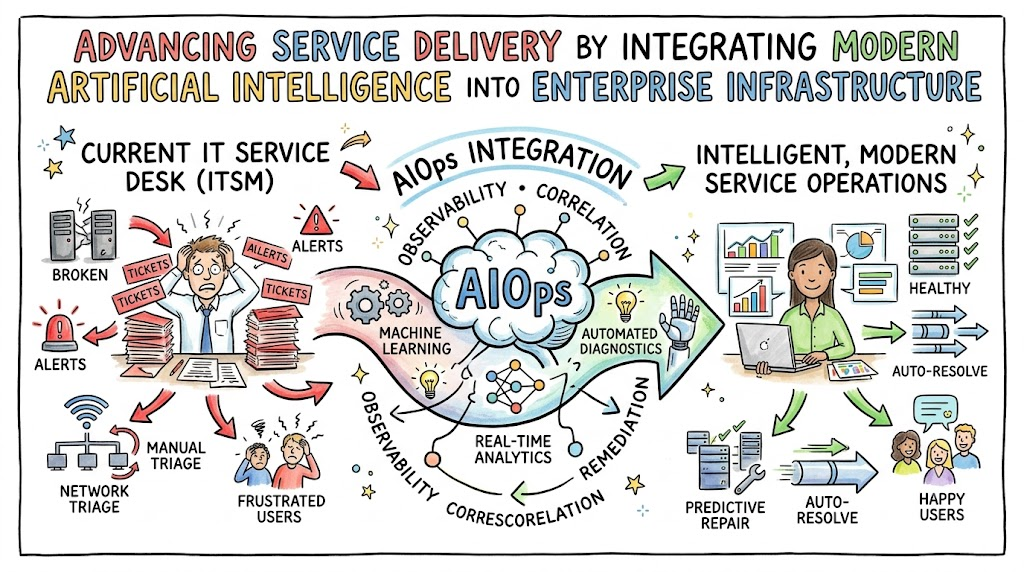
Modern enterprise systems generate massive volumes of operational telemetry every minute, creating unprecedented visibility challenges for service desks. Consequently, traditional ticketing systems struggle to keep pace with dynamic cloud workloads and distributed architectures. When service desks face continuous alert floods, manual triaging inevitably stalls, leading to extended service outages and technician burnout. By applying intelligent machine learning models across live event pipelines, modern operations teams shift from reactive firefighting to predictive service delivery. Integrating automated diagnostics directly into service management workflows empowers organizations to identify anomalies early, optimize operational resources, and resolve underlying infrastructure bottlenecks proactively.
To accelerate this transformation across complex enterprise ecosystems, technical leaders frequently rely on specialized educational and enablement platforms like Xopsschool. Implementing these advanced frameworks helps teams bridge historical data silos while aligning operations directly with modern user expectations. As machine intelligence unifies log aggregation, distributed tracing, and configuration items, service desk teams achieve comprehensive cross-stack transparency. Therefore, operations engineers can spend less time sifting through thousands of repetitive alerts and more time delivering resilient digital services that sustain continuous enterprise innovation.
The Evolution of Intelligent Service Operations
Traditional IT service management evolved around rigid, manual ticket classification and human-driven escalations. Consequently, service desks often operated in isolated operational silos, addressing system failures only after end users submitted complaint tickets. However, modern microservice architectures generate rapid event cascades that overwhelm traditional rule-based workflow engines. When service management teams adopt machine-learning-driven analytics, the entire operating model changes from static process tracking to real-time predictive awareness. Intelligent platforms ingest unorganized operational signals from diverse endpoints, instantly structuring this telemetry into clear context for support teams.
Furthermore, machine intelligence continuously refines underlying service models by analyzing real-time operational outcomes. Whenever technicians resolve complex incidents, automated models capture resolution steps, updating historical knowledge bases to guide future diagnostics. As a result, repetitive incidents trigger automated recovery scripts before minor degradations escalate into severe outages. Transitioning from reactive ticket routing to intelligent service management eliminates administrative bottlenecks, ensuring seamless coordination across operations, engineering, and business teams.
Key Operational Concepts You Must Know
Automated Anomaly Detection and Dynamic Baselining
Static alerting thresholds consistently fail in variable cloud environments, creating endless false alarms during routine traffic spikes. In contrast, modern machine learning systems establish dynamic behavioral baselines by analyzing seasonal workload trends across historical operational data. Whenever infrastructure metrics deviate significantly from these adaptive baselines, intelligent monitoring agents flag the irregularity immediately. This early detection capability allows support engineers to investigate performance drops long before service disruption reaches internal users or external customers.
Additionally, dynamic baselining accounts for cyclical business patterns, such as scheduled maintenance windows or midday payroll processing spikes. Because the analytics engine recognizes predictable operational changes, support teams experience a marked reduction in false positives. Therefore, engineers can dedicate their immediate attention to genuine system anomalies that threaten critical business transactions. Implementing dynamic statistical baselining establishes an essential layer of reliability that standard static threshold alarms simply cannot deliver.
Cross-Domain Event Correlation and Causal Analysis
Modern enterprise applications depend on hundreds of interdependent components, ranging from serverless containers to distributed database clusters. When a single underlying network switch fails, dozens of connected services simultaneously emit critical warning alerts. Cross-domain event correlation aggregates these disjointed operational alarms into a single, unified incident timeline. As a result, support engineers avoid deciphering hundreds of duplicate notifications and instead review one contextualized, prioritized service event.
Moreover, machine intelligence utilizes structural configuration databases to map topological dependencies among active workloads. By tracing data pathways across connected services, the diagnostic engine identifies the root failure point with high mathematical certainty. This rapid causal analysis eliminates finger-pointing among infrastructure, network, and application teams during mission-critical outages. Consequently, technical teams pinpoint structural defects quickly, significantly shortening overall recovery timelines while maintaining high service availability.
Platform Implementation vs. Culture — What’s the Real Difference?
| Operational Dimension | Platform Implementation Focus | Cultural Alignment Focus |
|---|---|---|
| Primary Objective | Ingesting diverse telemetry, deploying machine learning algorithms, and configuring dashboards. | Cultivating operational transparency, cross-functional empathy, and continuous learning habits. |
| Daily Activity | Managing data pipelines, writing correlation scripts, and integrating API webhooks. | Conducting blameless post-mortems, sharing incident insights, and adopting proactive habits. |
| Measurement Criteria | Processing throughput, alert reduction percentages, and pipeline integration counts. | Team trust levels, collaborative cross-team troubleshooting, and employee retention. |
| Long-Term Impact | Builds the technical data infrastructure to spot anomalies and automate incident workflows. | Sustains proactive service habits as technological tools evolve or enterprise scales. |
Purchasing sophisticated analytical software rarely solves operational inefficiencies if team culture remains fundamentally disconnected and adversarial. When development, security, and infrastructure groups protect private data silos, intelligent analytics engines lack the comprehensive context needed for accurate diagnostics. Therefore, leadership must cultivate psychological safety, encouraging engineers to share incident data without fear of blame. Fostering transparent collaboration ensures that the entire engineering organization embraces automated workflows rather than resisting algorithmically driven recommendations.
Furthermore, cultural transformation requires continuous communication between service desk agents and software development engineers. When automated diagnostics identify recurring codebase defects, development teams must treat these operational findings as high-priority backlog items. This collaborative feedback loop dismantles historical barriers between operations and development groups. Consequently, combining advanced algorithmic platforms with an open, blameless team culture enables organizations to sustain resilient service management workflows over the long term.
Real-World Use Cases of Modern Operations
Autonomous Ticket Triage and Intelligent Routing
In large-scale enterprise environments, service desks process thousands of incoming employee support tickets every day. Traditionally, frontline agents spent considerable operational hours manually categorizing, prioritizing, and assigning these requests to appropriate specialized teams. By implementing natural language processing and pattern recognition models, the intake pipeline analyzes ticket descriptions instantly upon submission. The intelligent system extracts critical entities, assesses business urgency, and automatically routes the ticket to the exact technical resolver group.
[User Submits Support Ticket] -> [NLP Analyzes Intent & Urgency] -> [Automated Enrichment with Telemetry] -> [Routed Directly to Resolver Team]
Because the algorithmic classifier enriches the ticket with recent system logs and related environment metadata, technicians begin remediation immediately without requesting additional details. Meanwhile, common requests such as access provisioning or password resets trigger self-healing runbooks that fulfill requests autonomously. Consequently, manual triaging backlogs disappear, accelerating resolution turnaround times while freeing human specialists to solve higher-value engineering challenges.
Proactive Infrastructure Healing
Another practical operational application involves identifying subtle memory leaks in microservice application pools before users notice performance lags. As containers continuously process transactions, intelligent monitoring platforms track application memory consumption rates across multi-cluster environments. When predictive forecasting algorithms detect that an application pool will exhaust resources within several hours, the system initiates automated healing runbooks.
- Telemetry Gathering: Continuous ingestion engines monitor container performance metrics in real time.
- Trend Extrapolation: Machine models detect abnormal memory leak patterns exceeding baseline tolerances.
- Runbook Initiation: Orchestration engines safely spin up fresh instances while gracefully draining existing workloads.
- Incident Logging: The platform automatically updates service records detailing the proactive maintenance step.
By addressing latent performance degradation before services drop connections, organizations prevent costly service level agreement breaches entirely. This self-healing architecture protects digital revenue streams while delivering an uninterrupted experience to end users across the globe.
Common Mistakes in Operations Engineering
Ingesting Dirty Data Without Governance
A frequent misstep organizations commit during analytics deployments is funneling massive volumes of unformatted, uncurated data into machine learning engines. When monitoring pipelines ingest inconsistent log formats, uncalibrated metrics, and duplicate events, analytical models produce misleading recommendations. Consequently, engineers receive inaccurate incident classifications, leading to widespread distrust in automated operational systems. To prevent this, teams must establish strict data hygiene standards, standardizing schema formats across every reporting component.
Furthermore, operational leaders must implement comprehensive filtering rules at ingestion gateways to remove unneeded system noise. Ingesting repetitive informational debug logs wastes expensive cloud storage and degrades algorithmic training performance. Teams should regularly audit monitoring pipelines to verify that connected systems emit structured, highly contextual telemetry. Ensuring pristine data quality enables machine learning models to deliver dependable causal analyses during system disturbances.
Over-Automating Without Sufficient Guardrails
Another critical vulnerability arises when engineering teams deploy fully autonomous remediation scripts without adequate safety boundaries. If an automated script executes a sweeping database rollback or cluster reboot based on a false correlation, catastrophic cascading downtime can occur. Therefore, operational workflows must initially incorporate human-in-the-loop approvals for high-impact recovery actions until models establish proven reliability.
[System Anomaly Detected] -> [Automated Remediation Proposed] -> [Human Approval Gateway] -> [Safe Execution & Verification]
Additionally, organizations must build strict rate-limiting and rollback mechanisms into automated runbook orchestration engines. If an automated fix fails to restore service metrics within a specified timeframe, the pipeline should safely abort execution and escalate the ticket immediately. Establishing clear guardrails ensures that automated workflows protect system integrity rather than unintentionally magnifying service outages.
How to Become an Operations Expert — Career Roadmap
Mastering Core Telemetry and Analytical Scripting
Aspiring operational engineers must build an extensive understanding of modern operating systems, container orchestration platforms, and network protocols. You should learn to query structured log repositories, configure open-source metric aggregators, and automate mundane tasks using modern scripting languages. Once you understand foundational infrastructure mechanics, shift your focus toward machine learning fundamentals and data science concepts. Understanding how clustering algorithms, regression models, and anomaly detection statistical models process operational telemetry prepares you to configure intelligent automation engines successfully.
Progressive Engineering Milestones
- Entry-Level Operations Engineer:
- Master core Linux commands, shell scripting, and basic container lifecycle management.
- Learn standard service desk processes, incident documentation workflows, and service level metric monitoring.
- Build foundational skills in configuring standard metric dashboards and centralized log aggregation collectors.
- Mid-Level Service Automation Specialist:
- Design and maintain automated runbooks that orchestrate cross-platform remediation workflows.
- Configure dynamic alerting baselines and fine-tune event correlation rules across complex cloud environments.
- Implement integration pipelines linking monitoring systems directly with enterprise service desk platforms.
- Principal Infrastructure Architect:
- Establish enterprise-wide telemetry governance, observability standards, and automation safety frameworks.
- Align technical operations strategies with executive corporate goals to maximize service resilience and return on investment.
- Mentor cross-functional teams while championing cultural transparency and blameless operational procedures across the entire enterprise.
FAQ Section
- How does machine learning fundamentally change everyday service desk workflows?Machine learning automatically organizes unorganized telemetry, groups related incident tickets together, and suggests validated remediation steps to technicians. Consequently, frontline agents spend substantially less time manually sorting tickets and more time solving verified system issues.
- Can small IT teams benefit from intelligent operations without dedicated data scientists?Yes, modern turnkey platforms provide pre-trained machine learning models and out-of-the-box integrations that require no custom algorithmic coding. Small engineering teams can immediately leverage automated alert correlation and ticket enrichment capabilities without hiring specialized data science teams.
- Why do traditional static monitoring rules fall short in modern cloud architectures?Cloud environments continuously spin containers up and down, causing workload volumes and network routes to change dynamically. Static monitoring rules lack the contextual elasticity needed to distinguish between planned workload scaling and genuine infrastructure degradation.
- What core metrics reveal the business value of adopting intelligent operations?Organizations primarily evaluate success by measuring reductions in mean time to detect, mean time to resolve, and overall alert noise volume. Furthermore, tracking automated ticket deflection rates highlights substantial improvements in overall operational efficiency and user satisfaction.
- How can organizations ensure data privacy when analyzing operational logs?Teams must implement robust data masking and tokenization rules at log ingestion gateways before storing or analyzing incoming telemetry. Stripping personally identifiable information and sensitive credentials ensures that analytical pipelines remain fully compliant with strict regulatory privacy standards.
Final Summary
Modern service management demands that organizations evolve beyond slow, reactive troubleshooting by integrating intelligent automated analytics across their technical ecosystems. By replacing static thresholds with dynamic baselines and cross-domain correlation, engineering groups dramatically reduce alert fatigue while resolving operational issues proactively. Autonomous incident routing, proactive infrastructure healing, and topological root-cause analysis ensure that enterprise systems remain highly resilient amid accelerating digital complexity.
Nevertheless, achieving sustained operational excellence requires an equal commitment to cultural empathy, continuous cross-team education, and disciplined telemetry governance. When leadership champions blameless post-mortems and equips engineers with modern data skills, organizations transform operations from an expensive bottleneck into a strategic competitive advantage. Embracing continuous learning and advanced operational methodologies positions your teams to navigate complex technical landscapes smoothly and build dependable digital experiences for the future.