
Automotive Core Tools – Tutorial (about 60 minutes)
- View
The Automotive Core Tools are six connected quality methods that vehicle makers expect their suppliers to use when they develop and launch a part: Advanced Product Quality Planning (APQP), the Control Plan, the Production Part Approval Process (PPAP), Failure Mode and Effects Analysis (FMEA), Measurement System Analysis (MSA) and Statistical Process Control (SPC). Quality engineers, manufacturing and design engineers, programme managers and supplier-quality staff use them every day across the automotive supply chain. After this tutorial you will be able to explain what each tool is for, how the outputs of one tool become the inputs of the next, and how a supplier uses them together to move a new part from quotation to approved series production.
Course overview
Edition and status: the core tools are not a single standard but a family of reference manuals published by the Automotive Industry Action Group (AIAG, USA), several of them now jointly with the German Association of the Automotive Industry's Quality Management Center (VDA QMC). The current editions are: APQP 3rd edition and the stand-alone Control Plan 1st edition (both released by AIAG in March 2024; the Control Plan content was taken out of the APQP manual and given its own book); PPAP 4th edition (2006, second printing 2009, still current); the AIAG and VDA FMEA Handbook 1st edition (2019, second printing 2022), which succeeds the AIAG FMEA 4th edition of 2008 (AIAG still sells that older manual, and some customers still accept it); MSA 4th edition (2010, still current, no harmonised successor published); and the new AIAG and VDA SPC Manual 1st edition, released on 1 July 2026, which AIAG lists as the successor of the AIAG SPC 2nd edition (2005). The manuals are referenced by IATF 16949:2016, the automotive quality management system standard, and by carmakers' customer-specific requirements; the IATF started revising IATF 16949 in October 2024 and issued a status update on the second edition in July 2026, but the new edition was not yet published when this course was checked. Verified 2026-10-29 against the AIAG quality core tools catalogue, the joint AIAG and VDA SPC press release and the IATF Global Oversight news page.
Who it is for: engineers, technicians, quality and supplier-quality staff, programme and launch managers, and auditors who are new to the automotive supply chain or who have used one tool in isolation and now need to see the whole picture.
Prerequisites: none. Some familiarity with manufacturing (drawings, machining or moulding, inspection) helps, and basic statistics such as the average and the standard deviation make the MSA and SPC lessons easier, but every term is explained when it first appears.
By the end of this tutorial:
- You will be able to explain why the automotive industry created the core tools and which problem each of the six tools solves.
- You will be able to describe the five phases of APQP and the deliverables that come out of each phase.
- You will be able to follow the seven-step AIAG and VDA FMEA method and explain how Action Priority replaces the old risk priority number.
- You will be able to read a control plan and explain how it links the process flow diagram, the PFMEA and the shop floor.
- You will be able to judge whether a measurement system and a process are good enough, using gauge repeatability and reproducibility, control charts and capability indices.
- You will be able to assemble a PPAP submission, choose a submission level and interpret the customer's approval decision.
- You will be able to place the core tools alongside IATF 16949, the VDA volumes and other related standards.
Lesson 1 – Origins, purpose and scope
Why the industry needed common tools
Until the late 1980s each of the large American vehicle makers had its own supplier quality manual. A supplier delivering brackets to Ford, General Motors and Chrysler had to complete three different sets of forms, follow three different approval routines and train its staff in three slightly different ways of doing the same analysis. That cost money and caused errors, and it did nothing for the quality of the parts. The three manufacturers, working through the Automotive Industry Action Group, a non-profit industry association founded in 1982, agreed to write shared reference manuals instead. The first editions of the manuals for planning, part approval, failure analysis, measurement and statistical control appeared in the early 1990s, and together with the QS-9000 quality system requirements of 1994 they became known as the "core tools".
The idea behind them is simple: most quality problems are designed in or planned in long before series production starts. A supplier that understands early which characteristics matter, what could fail, how it will measure and how it will keep the process stable can prevent problems instead of sorting parts at the end.
From American manuals to a global family
The automotive supply chain is now global, and European makers developed their own methods through the VDA volume series (for example VDA 4 on quality assurance before series production, VDA 5 on measurement capability and VDA 2 on part approval). For years a supplier selling to German and American customers had to run two styles of FMEA and two styles of capability study. Since 2019 AIAG and VDA have started to publish joint manuals. The first was the AIAG and VDA FMEA Handbook in 2019; the second was the joint SPC Manual in 2026. The remaining manuals are still separate, so a supplier must know which edition each customer requires. That information lives in each customer's customer-specific requirements, usually shortened to CSRs.
What the core tools cover, and what they do not
The core tools cover the product and process development and launch of production parts and the control of series production. They apply to suppliers at every tier, from a tier-1 module maker that delivers directly to the vehicle plant to a tier-3 heat-treatment shop. They are methods and reference manuals, not a management system: they do not tell a company how to run management reviews or internal audits. That job belongs to IATF 16949, which requires the use of the core tools (or customer-approved equivalents) and audits whether they are used effectively. The tools also do not replace functional safety (ISO 26262), software process capability (Automotive SPICE) or cybersecurity engineering (ISO/SAE 21434), although an FMEA often feeds and is fed by those activities.
A useful way to remember the six tools is by the question each one answers:
- APQP – are we planning the product and process in a structured, on-time way, with nothing forgotten?
- FMEA – what could go wrong, how bad would it be, and what are we doing to prevent or detect it?
- Control Plan – which characteristics do we check, how, how often, and what do we do when something is wrong?
- MSA – can we trust the numbers our gauges and inspectors give us?
- SPC – is the process stable, and is it capable of meeting the specification?
- PPAP – has the supplier shown, with evidence from a real production run, that it understands all requirements and can meet them consistently?
Lesson 2 – Key concepts and vocabulary
These terms appear on forms, in audits and in customer meetings across all six tools.
- Characteristic – a measurable or observable feature of a product (a diameter, a torque, a coating thickness) or a process setting (an oven temperature, a press force).
- Special characteristic – a characteristic whose variation could affect safety, regulatory compliance, fit, function or later processing, and which therefore receives extra control. Customers use their own symbols and names, for example critical or significant characteristic.
- Customer-specific requirements (CSRs) – additional rules a vehicle maker publishes on top of IATF 16949 and the manuals, such as which PPAP level is the default or which FMEA edition must be used.
- DFMEA and PFMEA – design FMEA analyses how the product design could fail to do its job; process FMEA analyses how the manufacturing and assembly steps could fail to produce the product as designed.
- Failure chain – the linked trio of failure effect (what the customer experiences), failure mode (how the item or step fails) and failure cause (why it fails), analysed across levels of the system.
- Prevention control and detection control – a prevention control stops a cause from occurring or reduces how often it occurs (a poka-yoke fixture, a validated tool life); a detection control finds the failure mode or cause before the part leaves the process (a vision system, an end-of-line test).
- Action Priority (AP) – the rating, High, Medium or Low, that the AIAG and VDA FMEA uses to decide which risks need action first, based on the combination of severity, occurrence and detection.
- Process flow diagram – a picture of every step a part goes through, from receiving material to shipping, including inspection, storage, rework and transport.
- Control plan – the document that lists, for every process step, the characteristics controlled, the specification, the measurement method, the sample size and frequency, the control method and the reaction plan.
- Reaction plan – the predefined action an operator takes when a check fails or a process goes out of control, such as stopping, containing suspect parts and calling a supervisor.
- Gauge R and R (GRR) – a study that estimates how much of the observed variation comes from the measurement system itself: repeatability (the same person measuring the same part several times) and reproducibility (different people measuring the same part).
- Common cause and special cause variation – common causes are the many small, always-present sources of variation built into a process; a special cause is an unusual, assignable event such as a broken tool or a wrong material batch.
- Control limits – boundaries on a control chart calculated from the process's own data; they show what the process does, not what the customer wants. Specification limits come from the drawing.
- Capability indices (Cp, Cpk, Pp, Ppk) – ratios that compare the spread and centring of a process with the width of the specification; the "k" versions take centring into account.
- Part Submission Warrant (PSW) – the summary form, signed by the supplier, that declares a PPAP submission complete and the parts conforming, and on which the customer records the approval decision.
- Significant production run – a run made with the production tooling, gauges, process, materials, people, site and cycle time that will be used for series supply, from which PPAP evidence is taken.
Lesson 3 – Structure of the core tools
Because the core tools are a family of manuals, the "structure" to learn is how each one is organised and how they connect. This lesson walks through them one by one, then shows the chain that links them.
APQP: the framework that holds the others
APQP is a structured approach to planning a product and its manufacturing process so that the customer gets a part that meets requirements, on time, at the agreed cost. It is a framework rather than a single technique: it tells a cross-functional team which activities and deliverables are expected and when, and the other five tools are used inside it. The manuals present the work in five overlapping phases; the last one feeds lessons learned back into the next programme.
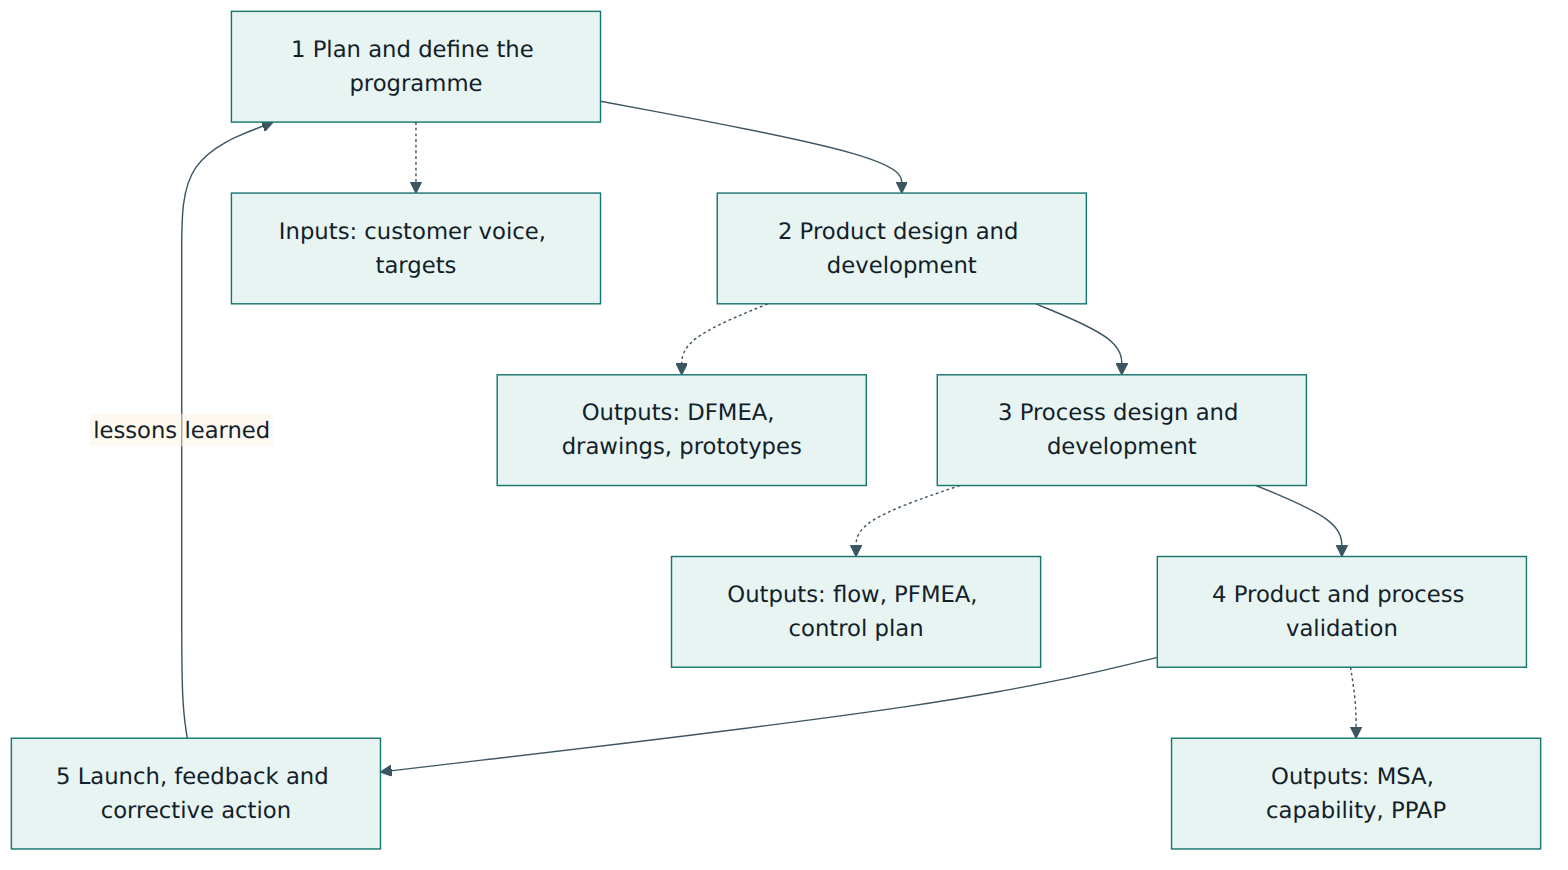
In outline, the phases are:
- Plan and define the programme. Gather the voice of the customer, business plan, product and reliability targets and initial lists of special characteristics; form the team and agree the timing.
- Product design and development. For a supplier that owns the design: design FMEA, design reviews, design verification plans, prototype builds, engineering drawings and specifications, and a feasibility commitment. A build-to-print supplier does less here but still reviews the design for manufacturability.
- Process design and development. Process flow diagram, floor plan, process FMEA, pre-launch control plan, work instructions, packaging, and the plan for measurement system studies and preliminary capability studies.
- Product and process validation. A significant production run, MSA studies, preliminary process capability studies, production validation testing, the production control plan and the PPAP submission.
- Launch, feedback, assessment and corrective action. Reduced variation, customer satisfaction, delivery performance and lessons learned; problems are solved with structured methods such as 8D.
The 3rd edition of the APQP manual (2024) keeps this logic but explains more of the reasoning behind each activity and adds guidance on sourcing, change management, programme metrics, risk mitigation planning and gated management, in which programme reviews at defined gates decide whether the project can move on. It also addresses agile ways of managing product development and part traceability. The control plan material moved to its own manual.
FMEA: the risk analysis at the centre
The AIAG and VDA FMEA Handbook describes a seven-step method used for both design and process FMEA, plus a supplement called FMEA for Monitoring and System Response (FMEA-MSR), which considers how on-board diagnostics detect a fault during vehicle operation and move the system to a safe state. The seven steps are grouped into three stages: system analysis (steps 1–3), failure analysis and risk mitigation (steps 4–6) and risk communication (step 7).
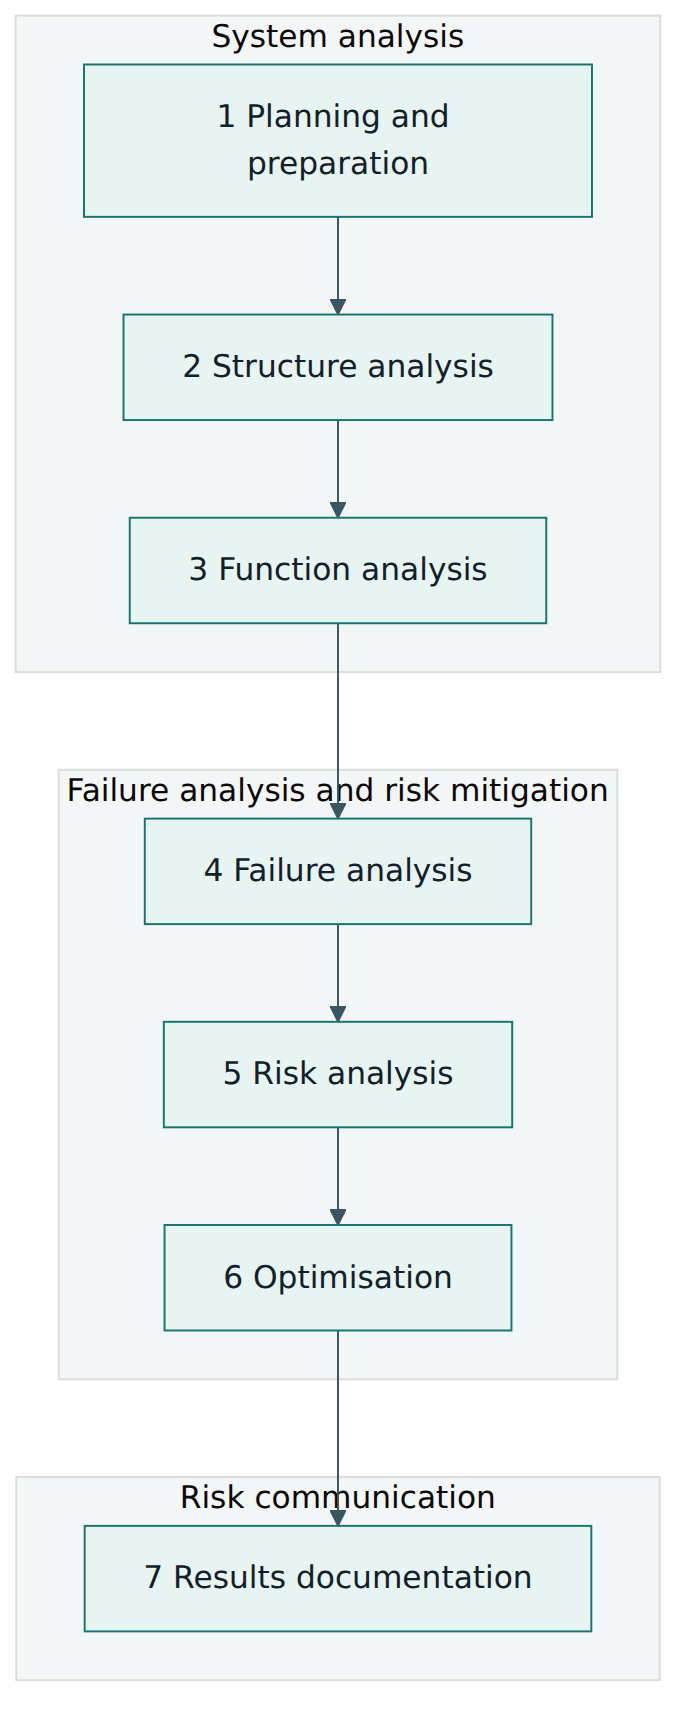
Planning and preparation sets the project scope and boundaries, often summarised as the "5Ts": intent, timing, team, task and tools. Structure analysis breaks the system into elements (for a PFMEA: process item, process step and process work elements, usually grouped into the 4M categories of person, machine, indirect material and environment, with method or measurement added where useful). Function analysis assigns functions and requirements to each element. Failure analysis builds failure chains of effect, mode and cause. Risk analysis records current prevention and detection controls and rates severity, occurrence and detection, each on a 1–10 scale, to arrive at an Action Priority. Optimisation assigns actions with owners and dates and re-rates the risk after the actions are verified. Results documentation reports what was found and decided to management and, where agreed, to the customer.
Control Plan: the bridge to the shop floor
The Control Plan manual (1st edition, 2024) describes how to develop and maintain control plans and how they link to APQP. A control plan is usually written per part or per part family and per phase. The manual recognises a prototype control plan (checks during prototype builds), a pre-launch control plan (extra checks between prototypes and full production), a safe-launch phase with heightened controls during the early weeks of production, and the production control plan for series supply. IATF 16949 Annex A lists the minimum content. Typical columns include the process step number and name, the machine or tool, the characteristic (product or process), the special characteristic symbol, the specification and tolerance, the evaluation or measurement technique, the sample size and frequency, the control method and the reaction plan.
MSA: trusting the data
The MSA manual explains how to evaluate measurement systems, both variable gauges (that give a number) and attribute gauges (that give a pass or fail). It covers the properties of a measurement system: resolution (the smallest change it can show), bias (the difference between the average measured value and a reference value), linearity (how bias changes across the operating range), stability (how bias changes over time) and precision, split into repeatability and reproducibility. It describes standard studies, most famously the GRR study, and gives guidance on judging the results.
SPC: understanding and controlling variation
The SPC manual teaches how to use data from the process to separate common-cause from special-cause variation with control charts, and how to state the process's ability to meet the specification with capability and performance indices. The new joint AIAG and VDA SPC Manual (2026) is intended to replace the differing AIAG and VDA approaches with one harmonised method for machine and process capability, qualification of production equipment and process monitoring, and its publishers state that it is aligned with the relevant international SPC standards. Because adoption is driven by customer-specific requirements, suppliers should check which SPC manual each customer currently expects.
PPAP: the evidence package
The PPAP manual defines when a submission is needed, which records the supplier must prepare and retain, the five submission levels and the possible customer decisions. PPAP is the point at which the outputs of all the other tools are collected and shown to the customer as proof.
The linkage between the tools
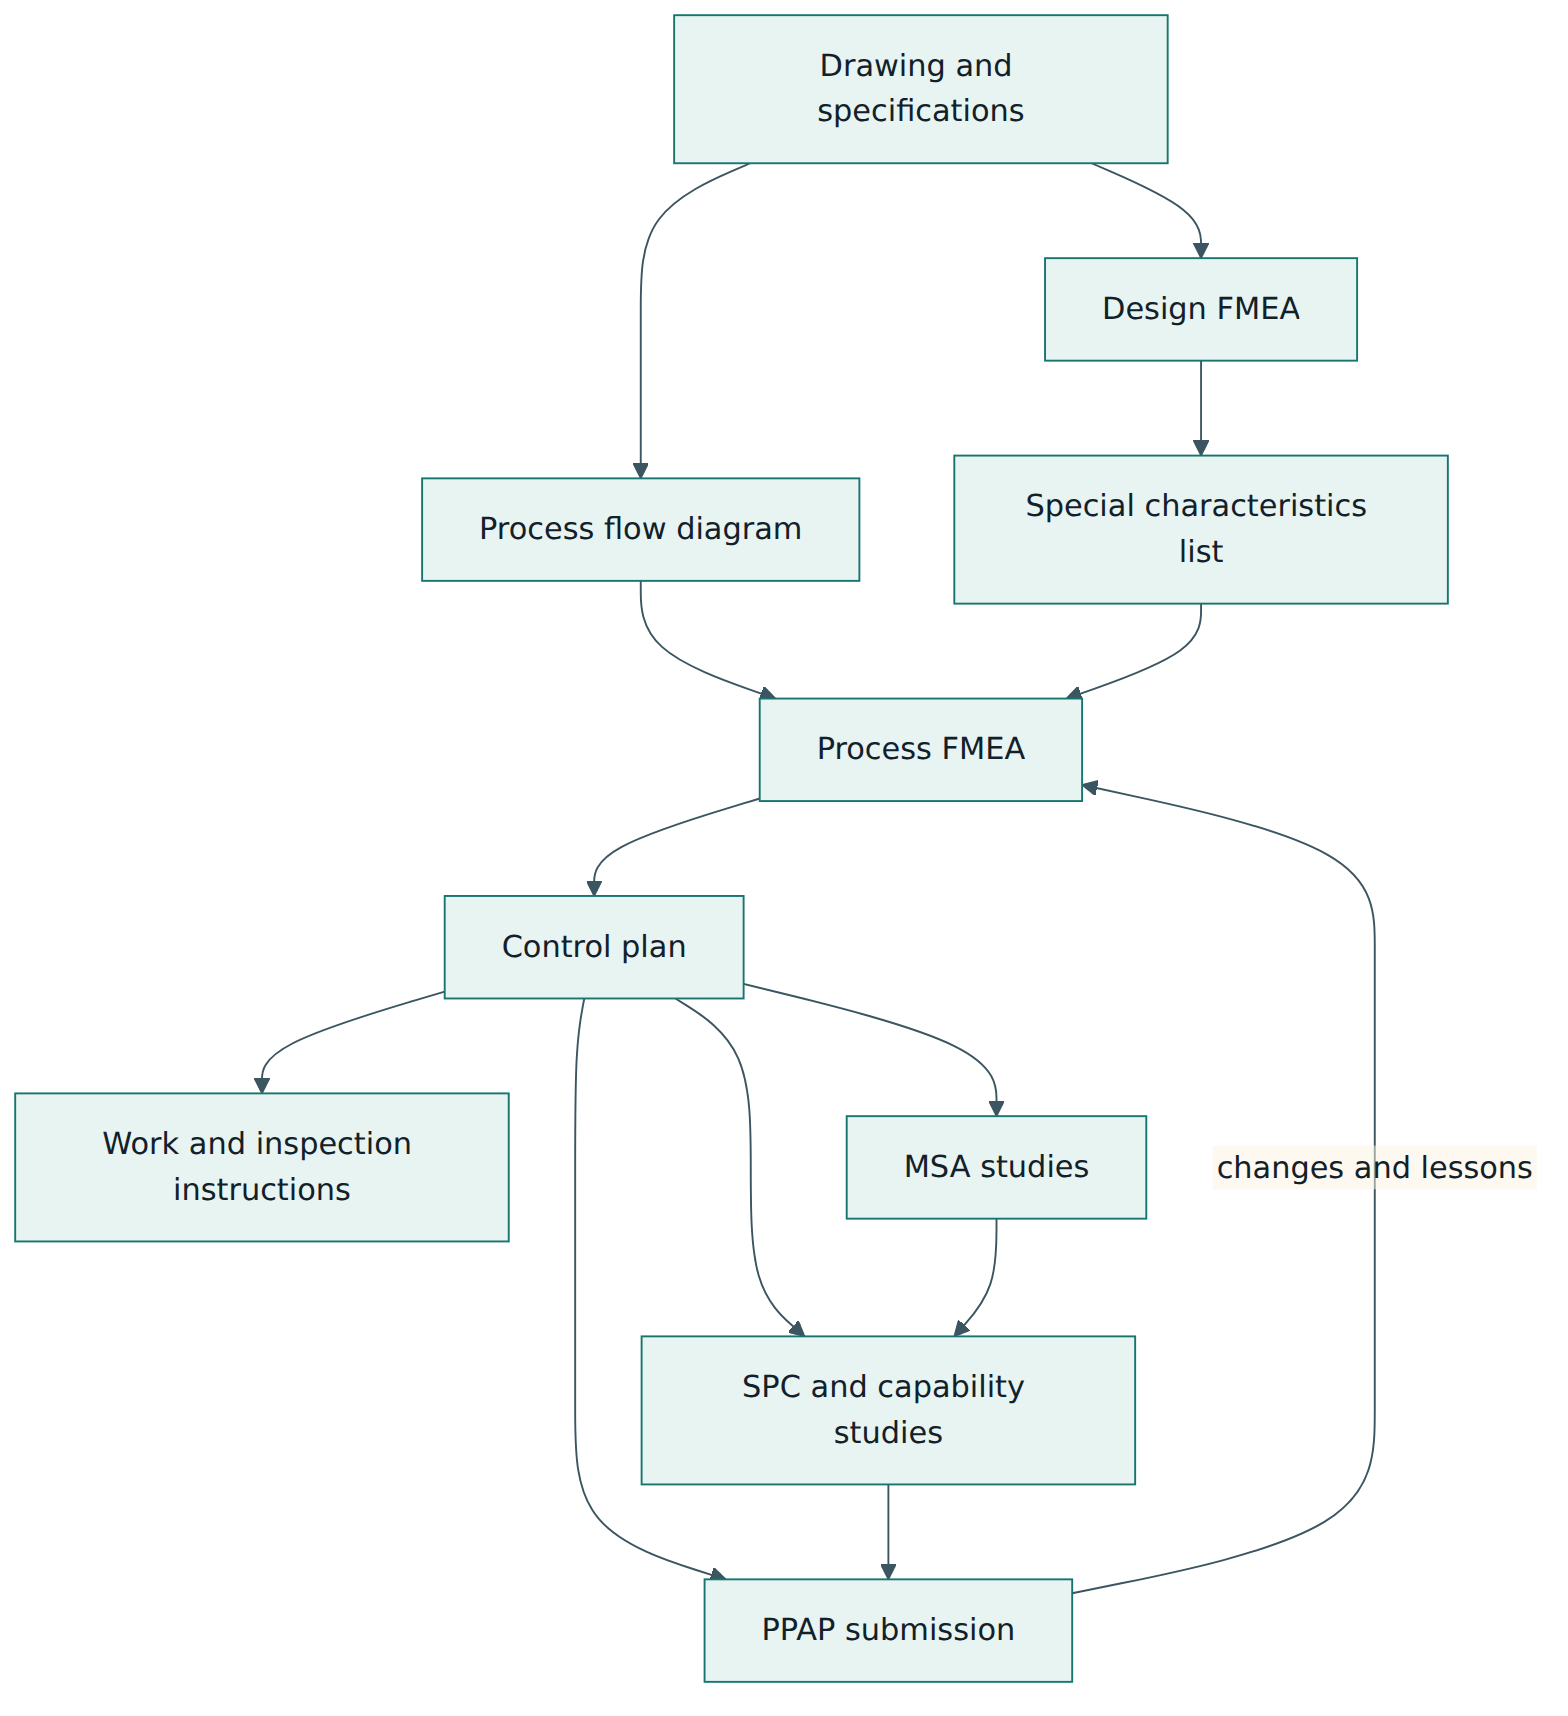
The most important structural idea is that the tools are a chain, not a pile of separate forms. A characteristic should appear consistently in the drawing, the DFMEA, the process flow diagram, the PFMEA, the control plan, the MSA plan, the SPC plan and the PPAP. Auditors often pick one special characteristic and trace it through every document; a break in that chain is a classic finding.
Lesson 4 – How the tools work in practice
Team and roles
All six tools assume a cross-functional team. A typical launch team in a supplier plant includes a programme or launch manager, a product or design engineer (if the supplier owns the design), a manufacturing or process engineer, a quality engineer, someone from purchasing or supplier development, a logistics or packaging representative, a production supervisor and, ideally, an experienced operator. An FMEA moderator or facilitator, who knows the method well, keeps the analysis disciplined.
Running an FMEA well
The quality of an FMEA depends far more on the team and the structure than on the form. Good practice is to start the DFMEA early, while design changes are still cheap, and to start the PFMEA from the process flow diagram so that every step, including transport, storage, rework and inspection, is covered. Severity is rated from the effect on the end user, the vehicle or the next process, with the highest ratings reserved for effects on safety and regulatory compliance. Occurrence is rated from how effective the prevention controls are, using history from similar products when available. Detection is rated from how likely the detection controls are to find the problem before the part leaves.
The AIAG and VDA method replaced the older risk priority number (RPN, the product of severity, occurrence and detection) with Action Priority. The reason is that two very different risks could produce the same RPN; a severity 10 risk with low occurrence could rank below a cosmetic issue. Action Priority uses lookup tables that give severity the greatest weight, then occurrence, then detection, and labels each combination High, Medium or Low. High means the team must identify an action or justify why current controls are adequate; Medium means it should; Low means it could. The aim is to reduce occurrence first through prevention, because detection only catches problems after they have been created.
Building and using the control plan
The control plan is drafted from the PFMEA: each prevention and detection control chosen in the FMEA should appear as a control method or check in the control plan, and each special characteristic should be shown with its symbol. The team then decides the evaluation technique (for example a bore gauge, a coordinate measuring machine, a leak tester), the sample size and frequency (five parts per hour, 100 percent, first and last piece), the recording method (control chart, check sheet, automatic data collection) and the reaction plan. The control plan must match reality: if it says "five parts every hour" but the work instruction says "every shift", it has failed. Operators work from instructions derived from the control plan, and layered process audits often check that the instructions are being followed.
Control plans are updated after complaints, internal non-conformances, product or process changes and PFMEA updates. A safe-launch period adds temporary extra checks, for example 100 percent inspection of a new feature or more frequent sampling, until the process has proven itself; the exit criteria for removing them should be defined in advance.
Measurement before capability
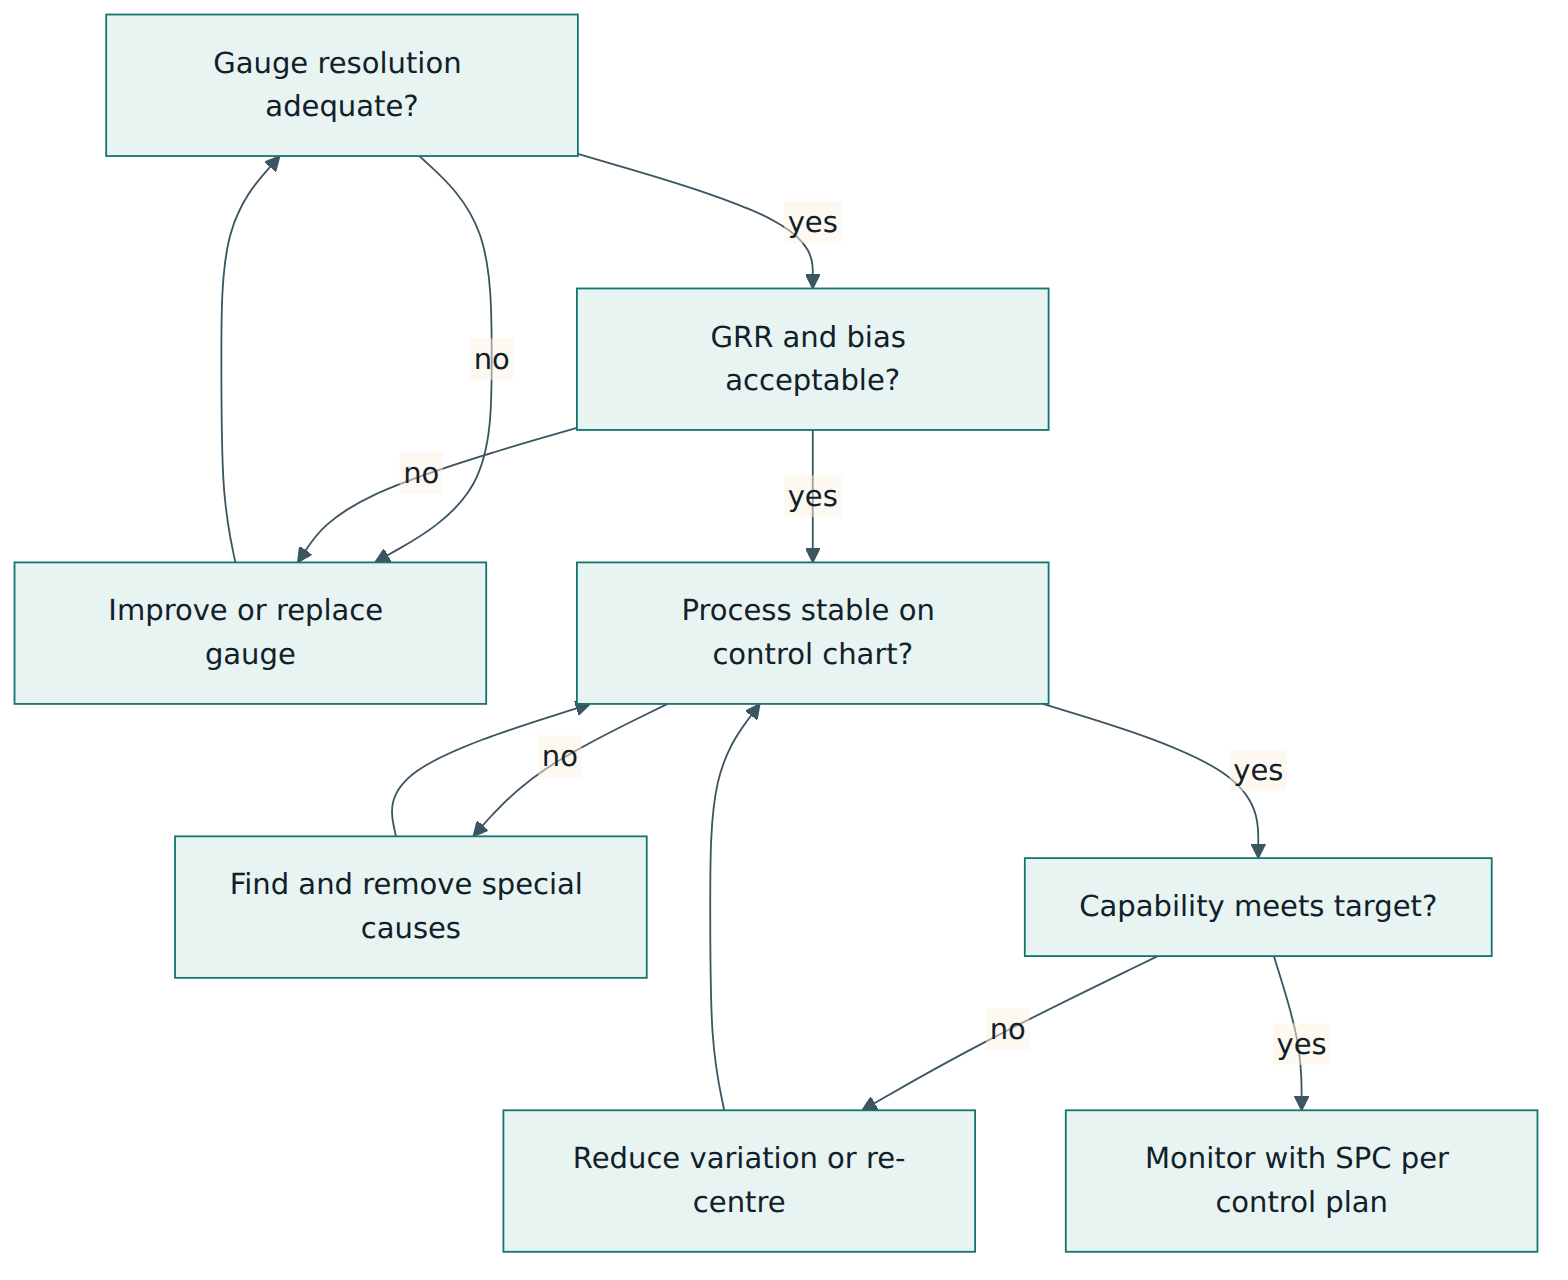
A capability study is only as good as the measurements behind it. If a gauge has a lot of variation of its own, a capable process can look incapable and a marginal process can look acceptable. For that reason the MSA plan is set up in phase 3 of APQP and the studies are carried out before or alongside the preliminary capability studies in phase 4. The order of questions is: can we measure it, is the process stable, and only then is it capable?
MSA in practice
A common variable GRR study takes about ten parts chosen to cover the expected process range, two or three appraisers, and two or three repeated measurements per part per appraiser, taken in random order without the appraisers knowing which part they measure. The results are expressed as a percentage of total variation (or of the tolerance, when the gauge is used to accept parts against the specification) and as the number of distinct categories (ndc), which tells how many groups of parts the system can reliably tell apart. The MSA manual's widely quoted guideline is that a GRR under 10 percent is generally acceptable, between 10 and 30 percent may be acceptable depending on the importance of the application, the cost of the gauge and the cost of repair, and over 30 percent is generally unacceptable; ndc should be five or more. The manual stresses that these are guidelines and that the customer may set its own rules. For attribute gauges, such as go/no-go plugs or visual inspection, an attribute agreement study checks whether appraisers agree with themselves, with each other and with a reference decision.
MSA applies to every measurement system listed in the control plan, not only to PPAP; IATF 16949 clause 7.1.5.1.1 requires statistical studies of those systems.
SPC in practice
A control chart plots a statistic of the process over time, such as subgroup averages and ranges, individual values and moving ranges, or the proportion of defective parts, together with a centre line and control limits calculated from the process's own data. Points outside the limits, or non-random patterns such as long runs on one side of the centre line or steady trends, signal a likely special cause. The operator follows the reaction plan: stop, contain, investigate, correct and record. Control limits must never be confused with specification limits. A process can be in control yet produce parts out of specification (it is stable but not capable), or be out of control while all parts happen to be within specification (it is capable for now but unpredictable).
Once a process is stable, capability can be judged. Cp compares the width of the specification with the spread of the process, ignoring where the process is centred. Cpk compares the distance from the process average to the nearest specification limit with half the process spread, so it falls when the process drifts off centre. Cp and Cpk use the within-subgroup (short-term) estimate of variation, while Pp and Ppk use the overall standard deviation of all data and therefore describe the performance actually delivered over the study period. For a preliminary study in PPAP, the PPAP manual uses Ppk: above 1.67 generally meets acceptance criteria, from 1.33 to 1.67 may be acceptable after discussion with the customer, and below 1.33 does not meet acceptance criteria. For ongoing production many customers expect a Cpk of at least 1.33 on special characteristics, but the exact values are set by each customer's CSRs.
Preparing the PPAP
PPAP evidence must come from a significant production run under real series conditions. The PPAP 4th edition describes eighteen requirements that a supplier must meet and keep records for, whether or not each one is physically submitted: design records; authorised engineering change documents; customer engineering approval where required; design FMEA (if design responsible); process flow diagrams; process FMEA; control plan; measurement system analysis studies; dimensional results; records of material and performance test results; initial process studies; qualified laboratory documentation; appearance approval report (for appearance items); sample production parts; a master sample; checking aids; records of compliance with customer-specific requirements; and the Part Submission Warrant. Bulk materials such as paints or fluids use a checklist that adapts these requirements.
Lesson 5 – Assessment, approval and compliance
There is no "core tools certificate" for a company
No body certifies an organisation as "core tools compliant". The tools are assessed in three indirect ways: through the customer's approval of each part (PPAP), through the IATF 16949 certification audit of the supplier's quality management system, and through customer or second-party audits such as process audits and launch readiness reviews. Individuals can attend training from AIAG, VDA QMC, certification bodies and consultancies, and some of these courses end with an examination and a personal certificate, but no single personal certificate is mandatory across the industry. IATF 16949 does require internal auditors to show competence in the core tools that apply to the processes they audit, and organisations train the engineers who apply them.
PPAP submission levels
The customer decides how much of the PPAP evidence the supplier must physically submit by choosing a submission level. Level 3 is the default unless the customer specifies otherwise.
| Level | What the supplier submits |
|---|---|
| 1 | Part Submission Warrant only (plus an appearance approval report for appearance items) |
| 2 | PSW with product samples and limited supporting data |
| 3 | PSW with product samples and complete supporting data (the default) |
| 4 | PSW and other requirements as defined by the customer |
| 5 | PSW with product samples and complete supporting data, reviewed at the supplier's manufacturing location |
Whatever the level, the supplier must hold all applicable records on file and make them available on request. A Level 1 submission does not mean less work; it means less paper sent to the customer.
Approval decisions
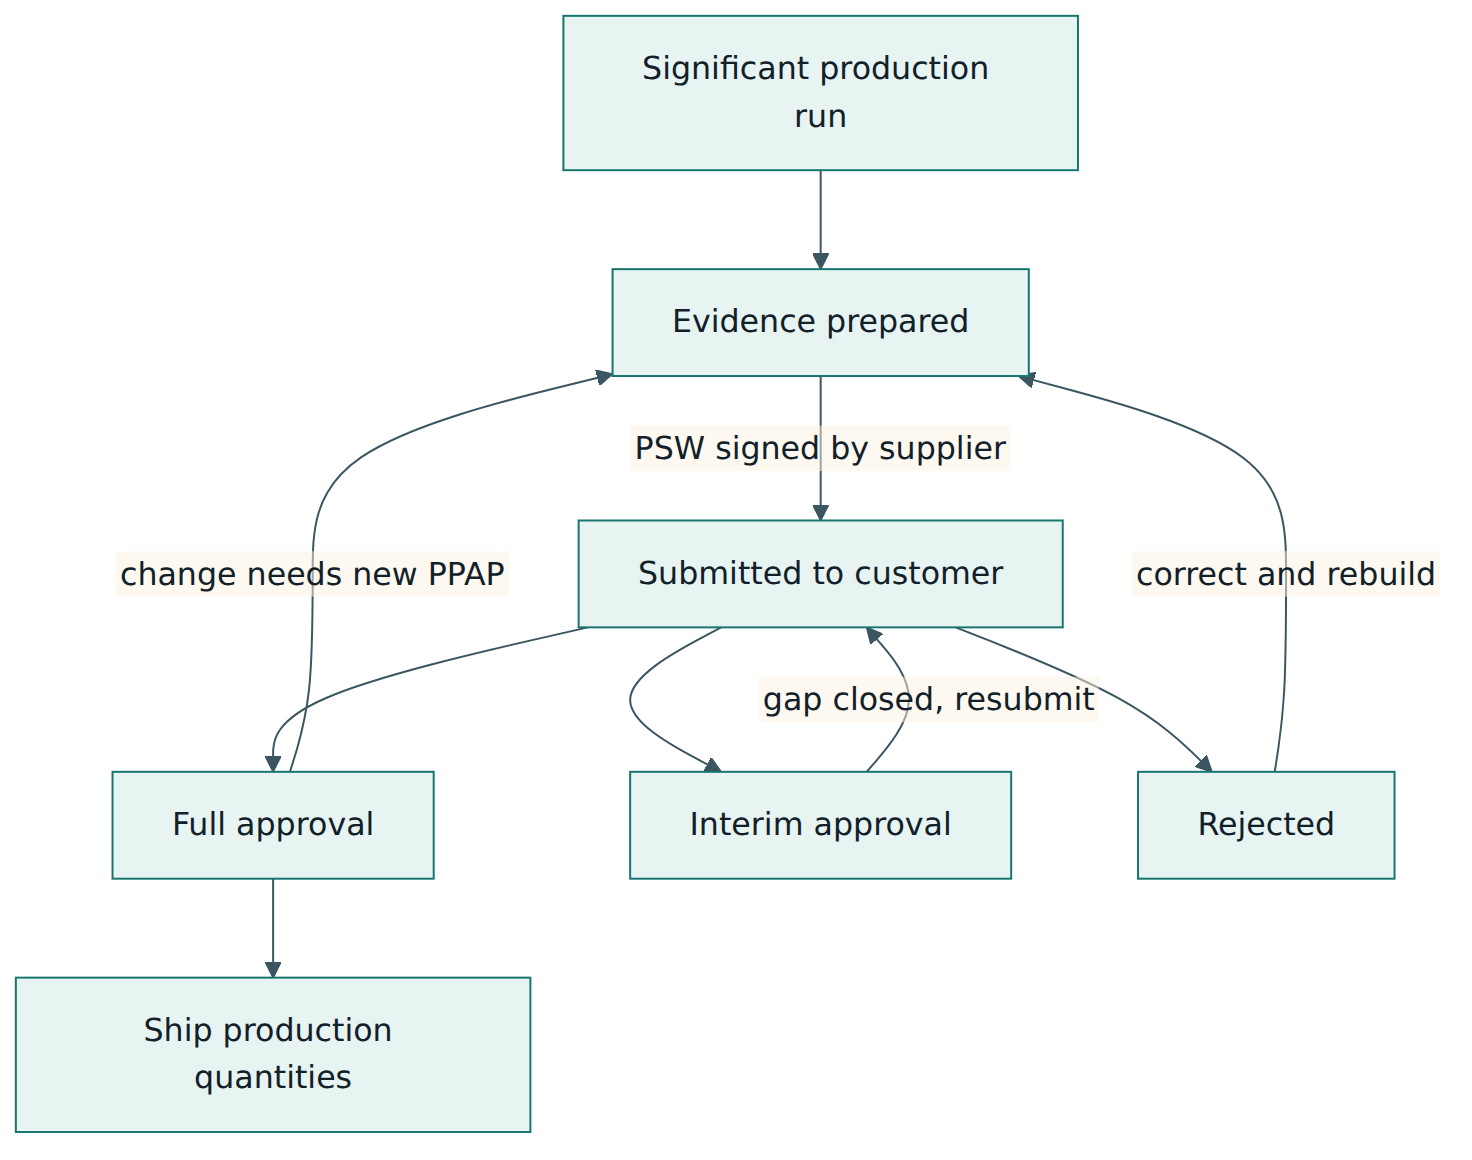
The customer records one of three decisions on the PSW. Full approval means the part meets all requirements and the supplier may ship production quantities. Interim approval allows shipments for a limited time or quantity while a known gap is closed, normally supported by an action plan and sometimes by extra containment. Rejected means the submission or the parts do not meet requirements; the supplier must correct the problem and resubmit before shipping production quantities.
When a new PPAP is needed
The PPAP manual lists situations that require customer notification and usually a new submission, including a new part or product, correction of a discrepancy on an earlier submission, an engineering change, a change of material or construction, new or modified tooling, moving the process to a different plant or line, a change of subcontracted supplier or material source, tooling that has been inactive for a long period, and changes to test or inspection methods. The principle: the customer approved a specific combination of design, process, materials and site, so any change to that combination must be notified before changed parts are shipped.
How IATF 16949 auditors look at the tools
IATF 16949 certification audits are performed by certification bodies under IATF rules. Auditors do not re-run the analyses; they check that the tools are used effectively. Typical audit trails are: picking a recent customer complaint and checking whether the PFMEA and control plan were updated; picking a special characteristic and tracing it from the drawing to the control chart on the line; checking that gauges in the control plan have current MSA studies; checking that out-of-control points on SPC charts triggered the reaction plan; and checking that changes were notified to the customer.
Customer-specific requirements
Each vehicle maker's CSRs may modify the manuals, for example with a different default PPAP level, extra elements, capability targets or required editions. The manuals are the common baseline; the CSRs are the contract.
Lesson 6 – Worked example
To see the tools working together, follow a fictional but realistic supplier through one launch. Nordvale Components is a tier-2 supplier that machines aluminium castings. A tier-1 customer that builds thermal-management modules for electric vehicles awards Nordvale a new coolant pump housing. The customer owns the design; Nordvale builds to print. Start of production is planned for eleven months after the award.
Phase 1: planning and defining the programme
Nordvale forms a launch team led by a programme manager, with a process engineer, a quality engineer, a purchasing lead for castings, a logistics planner and the machining supervisor. The team reviews the drawing, the material specification, the customer's CSRs and the request for quotation. It notes three special characteristics marked by the customer: the bearing bore diameter (a functional fit, tolerance plus or minus 0.012 mm), the leak tightness of the coolant channel (a functional and safety-related requirement because coolant loss could damage high-voltage parts) and the flatness of the sealing face. The team writes a timing plan with gate reviews and signs a team feasibility commitment stating that the part can be made to specification at the planned volume, with two concerns recorded: casting porosity and bore size stability as tools wear.
Phase 2: design input as a build-to-print supplier
Because Nordvale is not design responsible, it does not write the DFMEA. It asks the customer for the relevant parts of the DFMEA so it understands why the bore and the leak test matter, and it provides manufacturability feedback: the team suggests moving a datum to reduce the stack-up of fixturing errors, which the customer accepts through an engineering change.
Phase 3: process design
The process engineer draws the process flow diagram: receive castings, incoming inspection, rough machining, finish machining (including the bearing bore), washing, leak test, final visual inspection, packaging and shipping, with rework and quarantine loops. From the flow diagram the team builds a PFMEA using the seven steps. For the finish-machining step it identifies the failure mode "bore oversize", with effects of bearing looseness and noise at the vehicle level (severity 7) and causes including tool wear and thermal growth of the spindle. The current prevention control is a tool life limit taken from the machine supplier's data; occurrence is rated 6 because there is no history on this alloy. Detection by a manual check of one part per hour is rated 7, because oversize bores made between checks would not be caught. With severity 7, occurrence 6 and detection 7, the lookup table gives Action Priority High.
In the optimisation step the team chooses two actions: automatic in-process probing with tool-wear compensation (a prevention control) and a sample of five parts per hour measured with an air gauge and plotted on an average and range chart (a detection control). After the actions are verified on trial parts, occurrence is re-rated 3 and detection 4, and the priority drops. For the leak test, the failure mode "porous casting not detected" receives a severity of 9 because of the risk to high-voltage components; the team adds a 100 percent automatic leak test with a calibrated master leak checked at every shift start, and an error-proofing interlock that prevents untested parts from reaching packaging.
The pre-launch control plan is written from the PFMEA. For the bearing bore it lists the step, the machine, the characteristic with the customer's special characteristic symbol, the tolerance, the air gauge, a sample of five parts per hour, an average and range chart, and the reaction plan: stop the machine, quarantine parts since the last good subgroup, inform the supervisor, measure the quarantined parts 100 percent, record the event. For safe launch, the team adds 100 percent bore measurement for the first six weeks of production, with exit criteria of zero escapes and stable charts.
Phase 4: validation
Before the significant production run, the quality engineer carries out MSA studies. The first GRR on the air gauge with ten parts, three appraisers and three trials shows a GRR of 18 percent of the tolerance and five distinct categories. Because the bore is a special characteristic with a tight tolerance, the team is not comfortable with "may be acceptable". It investigates and finds that appraisers insert the part at slightly different angles. A locating fixture is added and the study is repeated: GRR drops to 8 percent and ndc rises to nine. An attribute agreement study is run on the final visual inspection with reference samples showing acceptable and unacceptable casting surfaces; one inspector disagrees with the reference on two borderline samples and is retrained with boundary samples placed at the inspection station.
Nordvale then runs 300 consecutive parts with production tooling, operators, gauges and cycle time. The bore data show no out-of-control signals across 25 subgroups. The preliminary capability study gives a Ppk of 1.52. Under the PPAP guidance this falls in the range that may be acceptable after discussion, so Nordvale contacts the customer's supplier quality engineer, explains the remaining variation (spindle warm-up in the first hour of each shift) and proposes a warm-up cycle. The leak test shows all parts passing, and the sealing-face flatness study gives a Ppk of 1.81.
The quality engineer assembles the PPAP file at Level 3, the customer's default: the drawing with all characteristics numbered (a "ballooned" drawing), the engineering change record for the moved datum, the process flow diagram, PFMEA, control plan, MSA studies, dimensional results for five parts across every characteristic, material certificates for the castings, the initial process studies, the accredited laboratory's scope, sample parts, the master sample, records of CSR compliance and the signed PSW.
Decision and launch
The customer grants interim approval for three months, on condition that the warm-up cycle is introduced, the safe-launch 100 percent bore check stays in place, and a new capability study is submitted. Eight weeks later, with the warm-up cycle running, the bore study gives a Ppk of 1.74 on a larger sample and the charts remain stable. Nordvale resubmits and receives full approval. The safe-launch checks are removed according to the predefined exit criteria and the production control plan, without the extra checks, is released.
Three months into production, a leak-test failure rate creeps up. The SPC chart on leak rate shows an upward trend. The 8D investigation traces it to a new casting supplier's gating change made without notification. Nordvale contains the parts, informs its customer, requires the casting supplier to submit its own PPAP for the change, and updates its PFMEA with the newly understood cause and its incoming inspection plan with a porosity check. The episode shows the tools working as a loop: SPC detected a shift, the reaction plan contained it, the PFMEA and control plan were updated, and PPAP rules governed the change at the sub-tier.
Lesson 7 – Relationship to other standards and frameworks
IATF 16949 is the automotive quality management system standard, used together with ISO 9001. It is the main reason suppliers use the core tools: it requires product approval processes, control plans (with minimum content in its Annex A), measurement system analysis, statistical tools and risk analysis, and it obliges certified organisations to follow customer-specific requirements. In other words, IATF 16949 says that the tools must be used and audited; the manuals say how to use them.
The VDA volumes are the German counterpart. VDA 2 (production process and product approval, PPA) plays the role of PPAP for many European customers. VDA 4 covers quality assurance methods before series production and, together with AIAG, now shares the FMEA method. VDA 5 covers measurement and inspection process capability and differs in method from the AIAG MSA manual. VDA 6.3 is a process audit standard often used by customers to audit suppliers' development and production processes, including how the core tools are applied.
ISO 26262 and ISO/SAE 21434 address functional safety and cybersecurity of electrical and electronic systems. Their analyses (for example hazard analysis and risk assessment) are different from FMEA but share inputs and outputs: a safety-related failure mode found in a DFMEA may connect to a safety goal, and a safety requirement may become a special characteristic in production.
The ISO 22514 series on statistical methods in process management covers capability and performance indices; the new harmonised SPC manual states its alignment with relevant international SPC standards. IEC 60812 is the general international standard for FMEA and FMECA, used across industries; the AIAG and VDA handbook is the automotive-specific application.
| Standard or framework | Main purpose | Relationship to the core tools |
|---|---|---|
| IATF 16949:2016 | Automotive quality management system requirements, certified by third-party audit | Requires the tools and CSRs; audits their effective use |
| VDA 2 (PPA) | German production process and product approval | Counterpart to PPAP; customers specify which one applies |
| VDA 5 | Capability of measurement and inspection processes | Alternative method to AIAG MSA, often required by German customers |
| VDA 6.3 | Process audit of development, supply chain and production | Audits how the tools are applied in practice |
| ISO 26262 | Functional safety of road-vehicle E/E systems | Shares inputs with DFMEA; safety requirements can become special characteristics |
| IEC 60812 | Generic FMEA and FMECA method for any industry | The cross-industry base; the AIAG and VDA handbook is the automotive application |
| Automotive SPICE | Capability of software and system development processes | Covers software development, which the core tools do not address in depth |
Common pitfalls and best practices
Common pitfalls
- Treating the tools as paperwork for the PPAP binder, completed after the process is already built, so the analyses change nothing.
- Copying an old FMEA from a "similar" part without checking what is different, which carries forward wrong ratings and misses new failure modes.
- Breaking the linkage: a special characteristic appears in the drawing but not in the PFMEA, or a control in the PFMEA never reaches the control plan or the work instruction.
- Running capability studies before the measurement system has been checked, or on an unstable process, which produces misleading indices.
- Confusing control limits with specification limits, or recalculating control limits after every out-of-control point so the chart never signals.
- Writing vague reaction plans such as "inform quality" that give the operator no clear first action and no containment rule.
- Making process, material or sub-supplier changes without notifying the customer, which can void an approval.
- Letting documents go stale after launch, so the FMEA and control plan no longer match what happens on the shop floor.
Best practices
- Start the FMEAs early and from a complete structure (the process flow diagram for a PFMEA), with a trained facilitator and people who know the real process.
- Use one numbering system for characteristics across the drawing, PFMEA, control plan, gauges and charts so anyone can trace a characteristic end to end.
- Prefer prevention to detection: error-proofing and robust process design lower occurrence, while extra inspection only finds problems already made.
- Plan MSA in phase 3 and complete it before the significant production run; include attribute and visual inspections, not just gauges that give numbers.
- Keep reaction plans specific: who stops what, which parts are quarantined back to which point, and who decides on release.
- Define safe-launch exit criteria in advance and remove extra checks only when the data show they are met.
- Maintain a CSR matrix for every customer and check it whenever a manual or a customer requirement changes.
- Review FMEAs and control plans after every complaint, internal failure and change, and feed lessons learned into the templates for the next programme.
Summary and key takeaways
- The Automotive Core Tools are six connected methods (APQP, FMEA, Control Plan, MSA, SPC, PPAP) published as reference manuals by AIAG, some jointly with VDA, and required through IATF 16949 and customer-specific requirements.
- Current editions in late 2026: APQP 3rd edition and Control Plan 1st edition (2024), PPAP 4th edition, the AIAG and VDA FMEA Handbook (2019), MSA 4th edition and the new AIAG and VDA SPC Manual (July 2026).
- APQP is the framework: five phases from planning to launch and feedback, with the other tools used inside it.
- FMEA follows seven steps and ranks risks with Action Priority, giving severity the greatest weight and favouring prevention over detection.
- The control plan turns the PFMEA into concrete checks, frequencies and reaction plans, and it changes with each launch phase including safe launch.
- Judge a characteristic in order: trust the measurement (MSA), confirm stability (control charts), then assess capability (Cpk, Ppk).
- PPAP is the evidence package from a significant production run; the customer chooses the submission level and decides full approval, interim approval or rejection.
- The tools only work as a living, linked system that is updated after every change, complaint and lesson learned.
Reflection questions
- Pick a part you know well. Which of its characteristics would you treat as special characteristics, and how would you trace one of them through the PFMEA, control plan, MSA plan and SPC chart?
- In your organisation, at what point in a project does the FMEA usually start? What would change if it started one phase earlier?
- Think of a measurement used daily in your plant or lab. What evidence do you have that its variation is small compared with the tolerance, and what would you do if a GRR study showed 25 percent?
- A process has a Cpk of 1.6 but its control chart shows several points beyond the limits. How would you explain to a manager why the capability number cannot yet be trusted?
- List three changes your team made in the last year to a product, process, material or sub-supplier. Which of them should have triggered customer notification or a new PPAP, and were they handled that way?
Further reading and official sources
- Quality Core Tools (APQP, CP, PPAP, FMEA, MSA, SPC) – AIAG
- Advanced Product Quality Planning, 3rd edition – AIAG
- Control Plan, 1st edition – AIAG
- Measurement Systems Analysis, 4th edition – AIAG
- VDA and AIAG publish joint standard for statistical process control – VDA
- IATF 16949 and customer-specific requirements – IATF Global Oversight
- The new APQP 3rd edition and stand-alone Control Plan – AIAG blog
Original tutorial by xOps School (DevOpsSchool Private Limited), written from public sources about Automotive Core Tools. Not affiliated with or endorsed by the standard's owner; standard names are trademarks of their owners. Buy the official standard from its publisher for the authoritative text.