
ISO/IEC/IEEE 15939 – Tutorial (about 60 minutes)
- View
ISO/IEC/IEEE 15939 is the international standard that describes a measurement process for systems and software engineering and management. It explains how to work out what people need to know, choose and define the measures that answer those needs, collect and analyse the data, and turn the results into information that is actually used in decisions. Project and programme managers, engineering leads, quality and process-improvement specialists, PMO analysts and systems engineers use it to build measurement programmes that answer real questions instead of producing charts that nobody reads. After this tutorial you will be able to explain the measurement process and its information model, write a complete measure specification that starts from a decision-maker's question, and judge whether a measurement programme is healthy.
Course overview
Edition and status: The current edition is ISO/IEC/IEEE 15939:2017, "Systems and software engineering – Measurement process", published in May 2017 (the IEC webstore lists 18 May 2017). It was developed jointly by ISO/IEC JTC 1/SC 7 (Software and systems engineering) and the IEEE Computer Society, and, as the first edition of the joint ISO/IEC/IEEE document, it cancelled and replaced ISO/IEC 15939:2007. ISO's catalogue records that the 2017 edition was reviewed and confirmed in 2022, so it remains the valid, citable edition. A revision is in progress: a Draft International Standard, ISO/IEC/IEEE DIS 15939 (listed as edition 2), has reached the enquiry (DIS) stage, with national standards bodies such as Standard Norge showing stage 40.20 and DIN Media listing a 41-page draft dated October 2026. A draft can still change before publication, so this course teaches the 2017 edition and the stable ideas that all editions share. Verified 2026-10-29 against the IEC catalogue entry, the publisher's preview of the 2017 edition, and the Standard Norge and DIN Media listings of the draft.
A note on copyright: the standard is a paid, copyrighted document. This tutorial explains its ideas in its own words and does not reproduce its definitions, tasks or annexes. Where exact wording matters, for example in a contract or an audit, buy the standard from ISO, IEC, IEEE or your national standards body.
Who it is for: anyone asked to "set up metrics" for a project, product, service or organisation: engineering and delivery managers, PMO staff, quality assurance and process-improvement people, systems engineers, team leads in agile teams, and acquirers who need trustworthy status information from suppliers.
Prerequisites: none. It helps if you have seen a project status report or an engineering dashboard and wondered whether the numbers on it meant anything.
By the end of this tutorial:
- You will be able to explain why the standard starts every measure from an information need and not from the data that happens to be available.
- You will be able to describe the four activities of the measurement process and how they connect to the processes that use the results.
- You will be able to use the measurement information model to trace a chart on a dashboard back to the attributes and methods that produced it.
- You will be able to write a measure specification (a measurement construct) with base measures, derived measures, an indicator and decision criteria.
- You will be able to plan how data is collected, verified, analysed, stored and reported, and who does each step.
- You will be able to evaluate a measurement programme and explain how conformance to the standard can be shown, given that no certification scheme exists.
- You will be able to place the standard next to ISO/IEC/IEEE 15288 and 12207, the SQuaRE quality measures, CMMI and Goal-Question-Metric.
Lesson 1 – Origins, purpose and scope
The problem the standard solves
Most organisations do not suffer from a lack of data. Issue trackers, build servers, version control, time sheets, monitoring tools and customer-support systems produce numbers all day long. The problem is that these numbers rarely answer the questions managers and engineers actually have. A team may publish forty charts every sprint while the programme director still cannot tell whether the release will be ready, whether quality is improving, or whether the new supplier is keeping up. Experienced practitioners describe this as being "data rich and information poor".
Three failure patterns show up again and again. First, measures are chosen because they are easy to collect, not because anyone needs them, so effort is spent on collection without any decision ever changing. Second, measures are poorly defined: two teams both report "defects", but one counts every ticket and the other counts only those confirmed by testers, so comparisons are meaningless. Third, numbers are used without context or are turned into targets for individuals, and people start optimising the number instead of the outcome. The last effect is often summarised as Goodhart's law: when a measure becomes a target, it tends to stop being a good measure.
ISO/IEC/IEEE 15939 tackles all three. It treats measurement as a process with a purpose, inputs, outputs and feedback, exactly like requirements engineering or configuration management. The process starts from what decision-makers need to know, defines each measure precisely, controls how data is gathered and checked, and closes the loop by evaluating whether the information produced was useful.
Where it came from
The ideas behind the standard grew out of practical work in large defence and government software programmes in the 1990s. In the United States, the Practical Software and Systems Measurement (PSM) initiative, sponsored by the Department of Defense and supported by industry, produced guidance on information-driven measurement for projects. PSM's central insight was that measurement should be driven by the issues and objectives of a specific project, and that a measure is only useful if it is connected to a decision. That guidance strongly influenced the first international standard, ISO/IEC 15939:2002 (software measurement process), and its second edition in 2007, which broadened the scope to systems as well as software.
The 2017 edition was produced jointly by ISO, IEC and IEEE, which is why its name carries all three prefixes. It was revised to align with the life cycle process standard ISO/IEC/IEEE 15288:2015 (system life cycle processes); ISO/IEC/IEEE 12207:2017 (software life cycle processes), published later the same year, describes the same measurement process. Both of those standards contain a short description of a measurement process. 15939 is the detailed, stand-alone elaboration of that process: if 15288 tells you that a project needs a measurement process and what it should achieve, 15939 tells you how such a process is organised in depth.
Purpose and outcomes
In the life cycle standards, the purpose of the measurement process is, in plain words, to collect, analyse and report objective data and information that support effective management and that demonstrate the quality of products, services and processes. A successful measurement process produces a small number of outcomes that you can use as a checklist:
- the information needs of the people who make decisions are identified;
- a suitable set of measures, chosen because they address those needs, is identified or developed;
- the required data is collected, verified and stored;
- the data is analysed and the results are interpreted;
- the resulting information gives objective support to decisions.
Notice that "producing a dashboard" is not an outcome. The final outcome is about decisions. A measurement process that produces beautiful charts but never changes a decision has not achieved its purpose.
Scope: what it covers and what it does not
The standard applies to system and software engineering and to their management. It can be used by an acquirer who wants information from a supplier, by a supplier running its own projects, by a single project, by a product line or by a whole organisational unit. It is explicitly flexible and tailorable, and it works with any life cycle model: waterfall, incremental, agile or DevOps. Although it is written for systems and software, the standard notes that the process can be applied in other domains too. It also does not assume an organisational model: each organisation decides, for example, whether it needs a separate measurement function and whether measurement sits inside individual projects or across them.
It is just as important to know what the standard does not do. It does not prescribe a list of measures that everyone must use. It does not set target values or thresholds. It does not mandate any tool, statistical technique or chart type, and it does not fix the name, format or medium of the plans and reports the process produces. It is not a management system standard like ISO 9001, and there is no certificate for "being 15939 certified". It defines a process framework and a vocabulary, and leaves the content, which measures and which thresholds, to the people who know the context.
Lesson 2 – Key concepts and vocabulary
Much of the value of the standard lies in its precise vocabulary. Everyday language uses "metric", "KPI", "measure" and "indicator" interchangeably. The standard separates them so that a team can say exactly how a number on a chart was produced. Modern ISO and IEEE standards prefer the word "measure" (as a noun) to "metric", and "metric" is best treated as informal speech. The terms below are explained in this tutorial's own words.
- Information need – the insight a person needs in order to manage objectives, goals, risks and problems, for example "Will we finish the integration phase on time?" Every measure should trace back to one.
- Measurable concept – an abstract relationship between attributes and an information need, such as "productivity", "growth in scope" or "stability of the product". It bridges the question and the data.
- Entity – the object that is measured: a product, a component, a document, a process, a project, a resource or a service.
- Attribute – a property of an entity that can be distinguished by a person or an automated means, for example the size of a code module or the duration of a review.
- Measurement method – the logical sequence of operations used to quantify an attribute against a specified scale. Methods are objective when they rely on counting or automated rules, and subjective when they rely on human judgement, such as a team's confidence rating.
- Scale and type of scale – the set of values a measure can take. The usual scale types are nominal (categories), ordinal (ordered categories), interval (equal distances, arbitrary zero) and ratio (equal distances, true zero). The scale type limits which arithmetic is meaningful.
- Unit of measurement – the agreed quantity used to express values, such as hours, story points, requirements or defects.
- Base measure – a measure of a single attribute obtained with one measurement method, such as "number of open defects" or "staff hours charged this week". Base measures are functionally independent of other measures.
- Measurement function – an algorithm or calculation that combines two or more base measures.
- Derived measure – the result of a measurement function, for example defect density (defects divided by size) or schedule variance (planned minus actual completion).
- Analysis model – an algorithm or calculation that combines measures with decision criteria, often using an expectation such as a plan, a baseline or a trend, to produce an indicator.
- Indicator – a measure that gives an estimate or evaluation of specified attributes in relation to an information need. An indicator is what usually appears on a chart, often with a colour.
- Decision criteria – thresholds, targets or patterns that tell people when to act or how confident they can be in a result, for example "investigate if burn rate exceeds plan by more than 10 percent for two consecutive weeks".
- Interpretation – the explanation of what the indicator means for the information need, including context the numbers alone cannot show.
- Information product – one or more indicators together with their interpretations, delivered to address an information need. A monthly status report or an annotated dashboard panel are information products.
- Measurement construct – the complete specification that links all the elements above for one information need. It is what many organisations call a "measure specification" or "metric definition sheet".
- Measurement plan – the document or set of artefacts describing which information needs are addressed, which constructs are used, and how data is collected, analysed, stored and reported.
- Measurement experience base – a store of evaluated information products, lessons learned and historical data that the organisation reuses in later projects, for example to build estimation baselines.
The measurement information model
The standard ties these terms together in a measurement information model. Read it from the bottom up and it explains how raw facts become information; read it from the top down and it shows how a question is turned into data to collect. Figure 1 shows the chain.
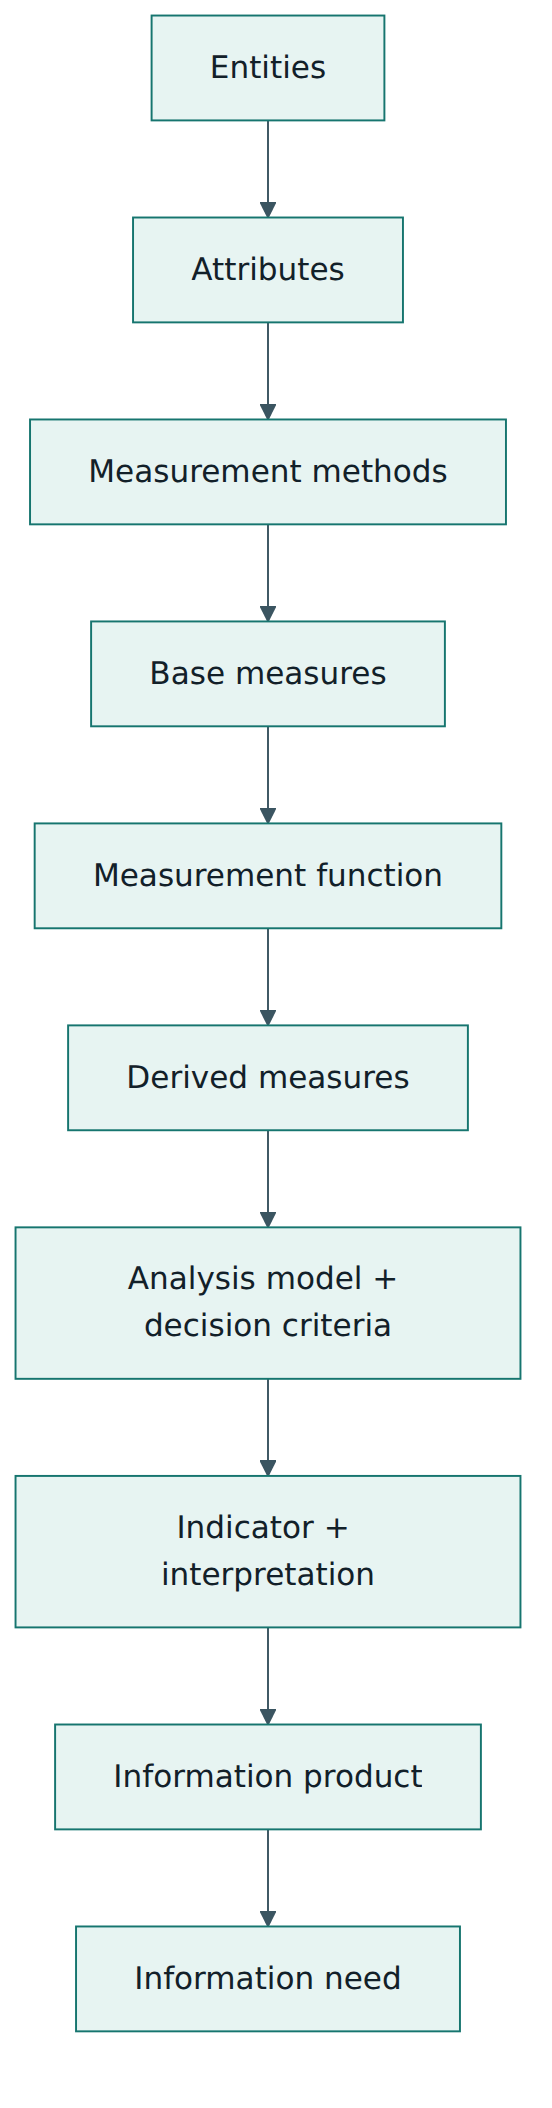
The model has three useful properties. First, it makes the chain auditable: anyone looking at an indicator can ask which derived and base measures it uses, which method produced each base measure, and which entity and attribute were measured. Second, it separates measurement (the bottom half: methods, base and derived measures) from analysis (the top half: analysis models, decision criteria and interpretation). Errors in the bottom half produce wrong numbers; errors in the top half produce wrong conclusions from correct numbers. Third, it shows where judgement enters. Methods can be subjective, analysis models embed assumptions, and interpretation always adds human context. Making these points explicit is how the model protects against false precision.
Not every construct needs every level. A simple information need ("How many critical defects are open today?") may use a single base measure directly as the indicator. A complex one ("Is the supplier's productivity sufficient to finish the remaining scope?") may combine several derived measures and a statistical analysis model. The model is a template for thinking, not a requirement to fill every box.
Lesson 3 – Structure of the standard
Like other process standards from ISO/IEC JTC 1/SC 7, the 2017 edition follows a familiar shape. Clause 1 sets the scope, clause 2 records that there are no normative references, and clause 3 defines the measurement vocabulary. Clause 4 covers conformance: intended usage, how to tailor the document, and the three ways of claiming conformance described in Lesson 5. Clause 5 explains how the document is applied and presents the measurement process model. Clause 6 is the measurement process itself: its purpose (6.1), its outcomes (6.2) and its activities and tasks (6.3), with one subclause for each of the four activities (6.3.1 to 6.3.4).
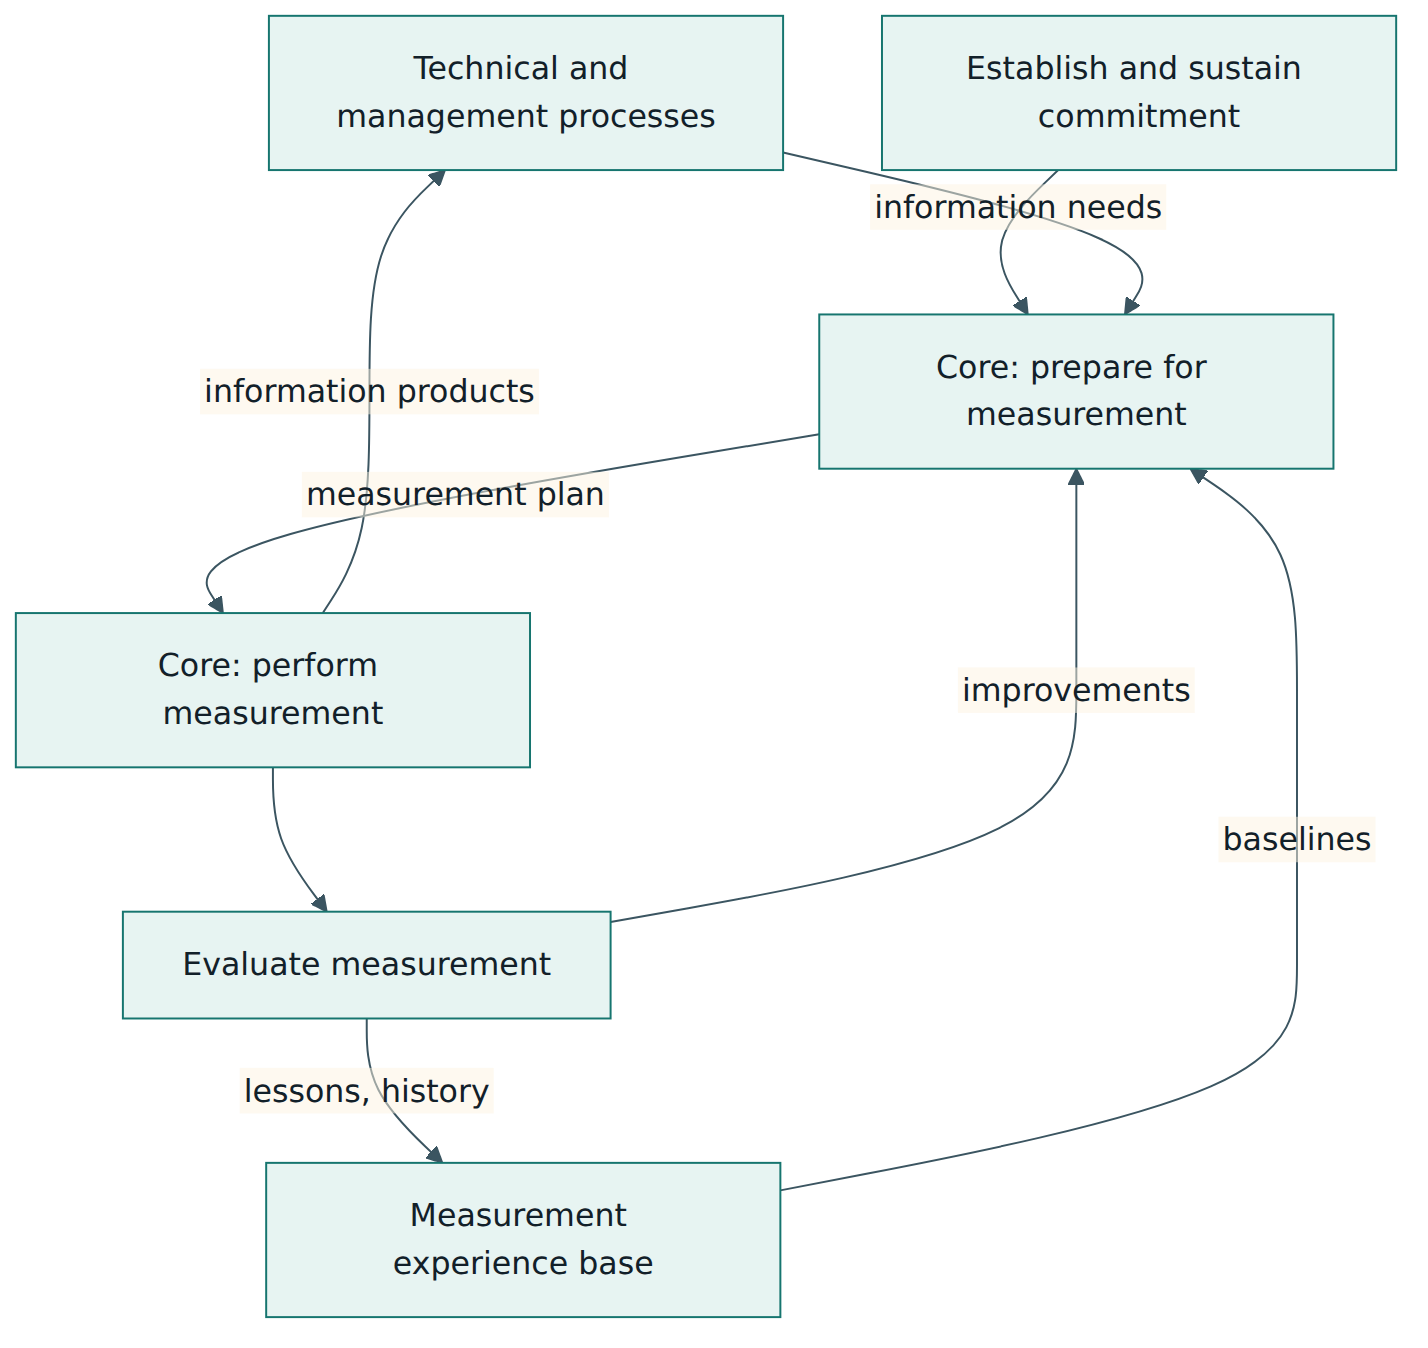
Seven informative annexes follow. Annex A explains the measurement information model and works through example constructs for productivity, quality and project progress. Annex B describes the information items and records the process produces. Annex C gives example criteria for selecting measures. Annex D gives example criteria for evaluating an information product, and Annex E example criteria for evaluating the performance of the measurement process. Annex F lists example elements of a measurement plan, and Annex G gives guidelines for reporting. The logic of the process model is shown in simplified form in Figure 2.
The four activities
The process is organised into four activities. Two of them, preparing and performing, form the core that runs on every cycle; earlier editions explicitly called this pair the core measurement process. The other two surround the core: one makes sure measurement has the backing it needs, the other makes sure it keeps improving. The 2017 edition takes the names of the two core activities from the life cycle standards, which describe preparing for and performing measurement, and keeps the commitment and evaluation activities that were already present in earlier editions. Earlier editions called the second activity planning the measurement process, so you will still meet "plan" in older material. Below, the typical tasks of each activity are summarised in our own words.
Activity 1: Establish and sustain measurement commitment (6.3.1)
Measurement costs time and money, and it touches how people work. Without management backing it quietly dies after the first reorganisation. This activity makes the commitment explicit. Typical tasks: agree the requirements for measurement and the scope (which projects or organisational unit), obtain management's commitment to fund measurement and, more importantly, to use the results, assign responsibility to named people, and provide resources such as tools, training and time. Commitment is "sustained" because it has to be renewed when sponsors change.
Activity 2: Prepare for measurement (6.3.2)
This is where most of the intellectual work happens. Typical tasks: characterise the organisational unit (its processes, life cycle, constraints and existing data sources); identify and prioritise information needs with the people who will use the results; select or develop measures that satisfy those needs, documenting each one as a construct; define procedures for collecting, storing, verifying, analysing and reporting the data; define the criteria that will later be used to judge whether the information products and the process itself are good enough; review and approve the plan; and acquire and deploy any supporting technology. The output is a measurement plan, which may be a document, a wiki page plus configuration files, or a section of the project management plan.
Activity 3: Perform measurement (6.3.3)
This activity executes the plan in the day-to-day rhythm of the project. Typical tasks: integrate the data collection procedures into the relevant engineering and management processes so that data is captured as a side effect of normal work; collect the data and verify it (completeness, plausibility, consistent units and definitions); store it with enough context to be reused; analyse it using the analysis models and decision criteria; prepare information products with interpretations; and communicate the results to the measurement users, then record what decisions they took.
Activity 4: Evaluate measurement (6.3.4)
Measurement must itself be measured. Typical tasks: evaluate the information products against the criteria defined during planning (were they timely, accurate, understood, used?), evaluate the measurement process (was it efficient, did people follow the procedures, were there data quality problems?), identify improvements, and store the lessons and the evaluated results in the measurement experience base. Improvements feed back into planning, which closes the loop.
Requirements, annexes and tailoring
The process clauses state what an organisation claiming conformance has to do, expressed as outcomes, activities and tasks. The annexes are informative, which means they give guidance and examples rather than requirements. The information model in Annex A is the conceptual heart of the standard, but you could follow the process with a differently drawn model as long as the outcomes are achieved. Tailoring is expected: a ten-person start-up and a defence prime contractor will run the same four activities at very different levels of formality.
Lesson 4 – How it works in practice
Reading the activities is easy. Running them so that people actually use the results is harder. This lesson walks through the practical steps, roles and artefacts most organisations end up with.
Roles
The 2017 edition does not prescribe an organisational model or job titles, but measurement guidance such as PSM, and practice in most organisations, distinguishes a few roles. You do not need a separate person for each; in a small team one person may hold several. What matters is that each responsibility is owned.
- The sponsor (often a senior manager) funds measurement and protects it.
- The measurement users are the decision-makers: project managers, product owners, engineering managers, acquirers. Their information needs drive everything.
- The measurement analyst designs constructs, analyses data and prepares information products with interpretations.
- The data providers are the people and systems that produce the raw data: developers, testers, build pipelines, ticketing systems.
- A repository owner (sometimes called a measurement librarian) manages the stored data, definitions and historical baselines so that they stay consistent over time.
From question to measure
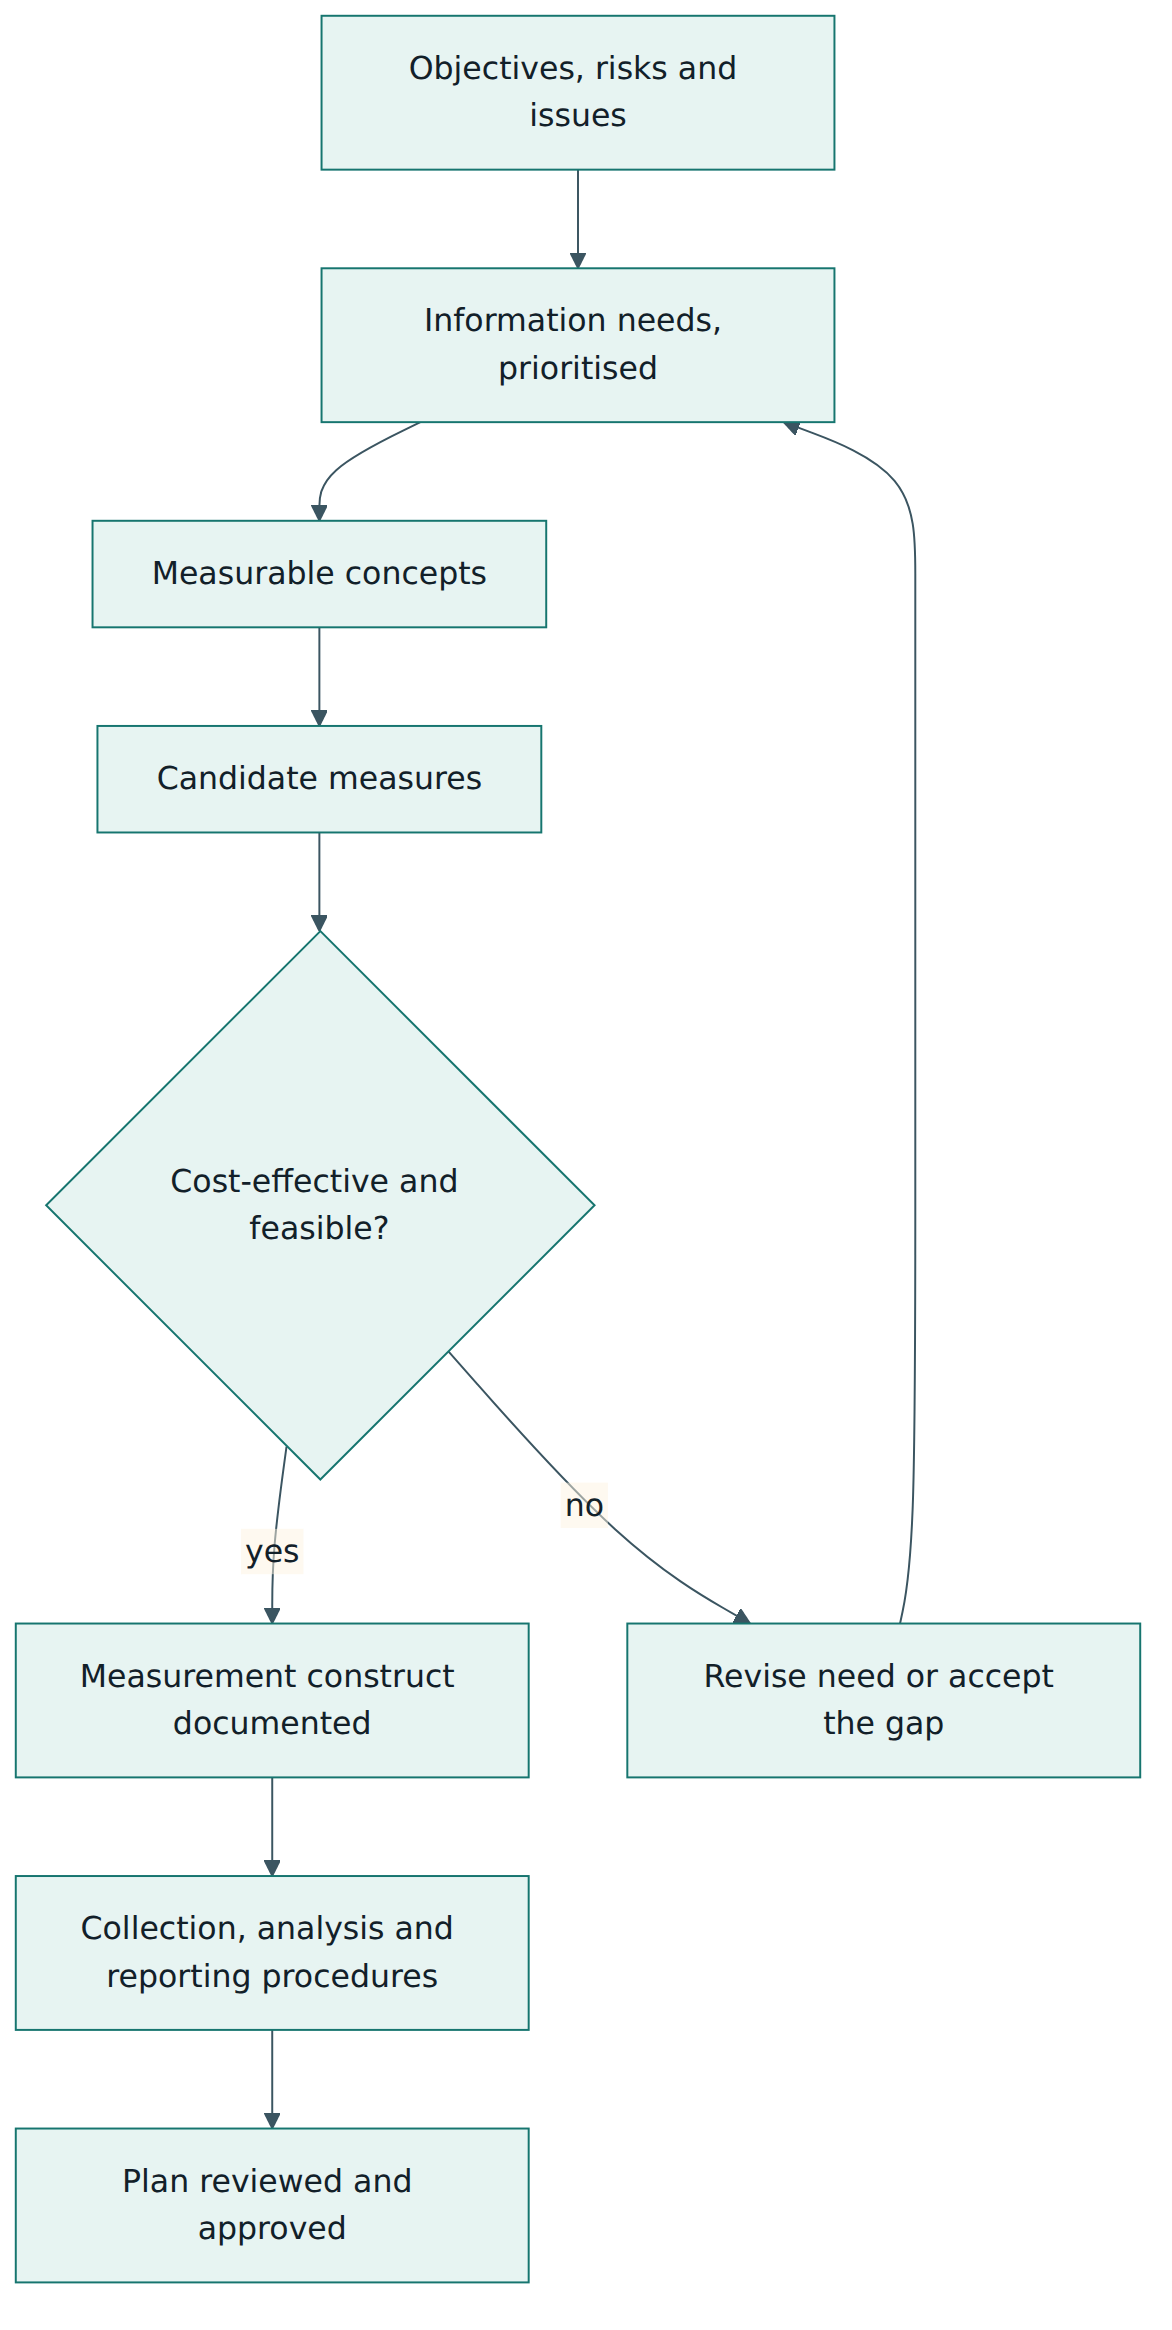
The heart of planning is translating vague concerns into precise constructs. Figure 3 shows the typical path. Notice that data sources are considered only after the question and the measurable concept are clear. If an important information need cannot be satisfied with existing data, the team either designs new data collection or explicitly accepts the gap.
A popular technique for the first steps is Goal-Question-Metric (GQM), developed in software engineering research and promoted by the Software Engineering Institute's goal-driven measurement guidance. A goal is stated ("improve release predictability"), questions are derived ("How far do actual release dates deviate from committed dates?"), and only then are measures chosen. GQM fits naturally into the planning activity of 15939; the standard's information model then adds the precision GQM leaves open, such as methods, scales and decision criteria.
Selecting good measures
When choosing among candidate measures, practitioners use criteria such as the following (Annex C of the standard gives its own set of example selection criteria): relevance to the information need, the cost of collection, the availability and reliability of the source, timeliness (data arrives in time to act), simplicity (people can understand it), repeatability (two people get the same value), and resistance to gaming. A small set of well-understood measures beats a large set that nobody trusts. A common guideline is to start with a handful of information needs that matter most to the sponsor and expand only when those are working.
Artefacts
A practical implementation usually produces the following artefacts. None of them needs to be heavyweight; many teams keep them in a wiki, a repository or a BI tool.
| Artefact | Contents | Owner |
|---|---|---|
| Measurement plan | Scope, information needs and their priority, list of constructs, roles, schedule of reporting, tools | Measurement analyst, approved by the sponsor |
| Measurement constructs (specifications) | For each need: entity, attributes, methods, base and derived measures, analysis model, indicator, decision criteria, interpretation guidance | Measurement analyst with the users |
| Data collection procedures | Source, frequency, who collects, verification rules, how to handle missing or late data | Data providers and analyst |
| Measurement repository | Raw and derived data with timestamps, definitions version and context notes | Repository owner (librarian) |
| Information products | Charts or tables with interpretation and recommended actions | Measurement analyst |
| Evaluation records | Feedback from users, data quality problems, proposed changes | Analyst and sponsor |
Collecting and verifying data
The most reliable data is captured automatically as a by-product of work: commits, builds, deployments, ticket state changes. Manual collection is sometimes unavoidable, for example for effort or for subjective ratings, but it should be quick and the purpose should be explained to the people providing it. Verification checks are part of the procedure, not an afterthought: are all teams reporting, are units consistent, did someone change the workflow states in the tracker so that "done" now means something else? A measure whose definition silently changes produces a trend line that looks meaningful and is not.
Analysing and communicating
Analysis compares data with an expectation: a plan, a historical baseline, a control limit, a target or a model. The output is an indicator, but the indicator alone is not enough. The analyst adds interpretation: what probably caused the pattern, how confident the conclusion is, what the options are. Good information products are short, tied to the question they answer, and delivered in the forums where decisions are taken, such as sprint reviews, monthly programme reviews or supplier meetings. Results should be discussed with the people whose work is measured before they are shown to senior management, both to catch misinterpretations and to maintain trust.
Measurement in agile and DevOps teams
Nothing in the standard requires heavy documentation. In an agile team, the planning activity might be a two-hour workshop that produces a one-page construct for each of five information needs, and the perform activity is largely automated from the tool chain. The evaluate activity fits neatly into retrospectives: "Did the cycle-time chart help us this sprint? Should we drop the velocity chart nobody looks at?" Delivery performance measures such as deployment frequency and lead time for changes, popularised by the DORA research programme, are good candidates for constructs, provided the team can say which information need each one addresses and what it will do when a value crosses a decision threshold.
Lesson 5 – Assessment, certification and compliance
There is no 15939 certificate
ISO/IEC/IEEE 15939 is a process standard, not a management system standard. There is no accredited certification scheme in which a third-party body certifies an organisation as "15939 compliant", and you should be wary of anyone offering one. What the standard does provide is a basis for claiming conformance, and a reference for audits and process assessments run under other frameworks.
Conformance claims
Like its sister SC 7 process standards, the 2017 edition (clause 4) offers three kinds of conformance claim. Full conformance to outcomes means showing that every outcome of the measurement process is achieved, however the organisation chooses to achieve it. Full conformance to tasks means showing that the required activities and tasks are performed. Tailored conformance applies when the document has been tailored, following its own tailoring guidance, so that only a selected or modified part of the process is claimed, for example in a contract that requires only parts of the process; the tailoring decisions should be documented and justified. Conformance claims are made by the organisation or demanded by an acquirer in a contract; they are checked by whoever has a stake, such as a customer, an internal auditor or an independent assessor.
How measurement processes are assessed in practice
Several established mechanisms look at measurement, and 15939 gives them a common reference:
- Process capability assessments – the ISO/IEC 330xx family (the successor to ISO/IEC 15504) defines how process assessment models are built and used. Assessment models for software and system life cycle processes include a measurement process derived from 12207 and 15288, and assessors use 15939 to understand what good looks like.
- CMMI appraisals – the CMMI model includes measurement practices (Measurement and Analysis in older versions; Managing Performance and Measurement in versions 2.0 and 3.0). An appraisal looks for evidence that measures are tied to objectives, that data is collected and analysed consistently, and that results are used.
- Management system audits – ISO 9001 and other management system standards require organisations to decide what needs to be monitored and measured and to evaluate the results. Auditors do not audit against 15939, but an organisation following it will find these requirements easy to evidence.
- Contractual reviews – in acquisition, an acquirer may require the supplier to run a measurement process consistent with 15939 and to deliver agreed information products, then check them at milestone reviews.
What an assessor looks for
| Question | Typical evidence |
|---|---|
| Is measurement backed by management? | Named sponsor and roles, budget or time allocation, minutes showing results discussed |
| Are measures driven by information needs? | A list of needs traced to constructs; no orphan measures |
| Are measures precisely defined? | Constructs with methods, scales, units and decision criteria; version history of definitions |
| Is data collected and verified as planned? | Procedures, verification logs, records of corrected data |
| Are results used? | Information products with interpretations; decisions or actions linked to indicators |
| Is the process evaluated and improved? | Evaluation records, retired or changed measures, updated experience base |
Evaluating the measurement process yourself
The fourth activity means an organisation should not wait for an external assessor. The standard's informative Annexes D and E offer example criteria: for information products, aspects such as whether they are used, how much confidence they deserve, whether they are fit for purpose and understandable, and how accurate, repeatable and reproducible the underlying methods are; for the process, aspects such as timeliness, efficiency, defect containment, customer satisfaction and process compliance. Practical self-evaluation measures include: the share of information needs that have a working construct; how often information products are delivered late; how many indicators led to a recorded decision in the last quarter; the frequency of data corrections; and the users' own rating of usefulness. A measure that has not influenced any decision for several cycles is a candidate for retirement. Retiring measures is a sign of a healthy process, not a failure.
Lesson 6 – Worked example
To tie the ideas together, follow a fictional but realistic organisation. Harbourline Logistics runs a shipment-tracking platform built by six teams, about sixty people in total. The platform is being moved to a cloud environment over the next nine months, with the first customer-facing release ("Release 3") due in five months. The chief technology officer asks the head of engineering to "set up metrics", and the head of engineering decides to use ISO/IEC/IEEE 15939 as the backbone.
Step 1 – Establish commitment
The head of engineering presents a one-page proposal to the CTO: purpose, scope (the six platform teams and the cloud migration programme), an estimate of effort (one part-time analyst plus about an hour per team per sprint), and a request that the CTO's monthly programme review uses the results to take decisions. The CTO agrees and names the head of engineering as sponsor and a senior engineer, Priya, as measurement analyst. The release manager agrees to act as measurement librarian for the shared repository.
Step 2 – Characterise the organisational unit and identify information needs
Priya interviews the CTO, the programme manager, two product owners and the team leads. She records the questions they actually ask in meetings and groups them. After a prioritisation workshop, four information needs are accepted for the first quarter:
- Will Release 3 be ready on the committed date with the agreed scope?
- Is the quality of the migrated services good enough to release?
- Is our delivery pipeline getting faster and more reliable during the migration?
- Are the cloud running costs in line with the budget?
Several other requests, such as "lines of code per developer" from a line manager, are explicitly rejected because no decision depends on them and they would encourage the wrong behaviour.
Step 3 – Specify a measurement construct
For information need 1, Priya writes the following construct with the programme manager.
| Element | Specification |
|---|---|
| Information need | Will Release 3 be ready on the committed date with the agreed scope? |
| Measurable concept | Progress of work against the release plan |
| Entities and attributes | Release backlog items (size estimate, state); the calendar (sprints elapsed) |
| Base measures | Total estimated size of committed scope; size of items accepted as done; sprints elapsed; sprints planned |
| Measurement methods | Objective: query the tracker at the end of each sprint for items in the release with state "accepted"; sum their estimates |
| Derived measures | Percent of scope done; percent of time elapsed; average size completed per sprint over the last three sprints |
| Analysis model | Forecast completion sprint = remaining size divided by recent average rate; compare with planned final sprint |
| Indicator | Forecast slip in sprints, shown as a trend with the scope line |
| Decision criteria | Green: slip of 0; amber: slip of 1 sprint; red: slip of 2 or more sprints or scope growth above 10 percent since baseline |
| Interpretation guidance | Check for scope added without re-planning; check whether "accepted" definitions changed; note team absences |
| Reporting | End of every sprint to the programme manager; monthly summary to the CTO review |
Similar constructs are written for the other needs. Quality uses escaped defects found in staging per service and the trend of open critical defects. Pipeline performance uses deployment frequency, lead time from merge to production and the percentage of deployments that need a rollback. Cost uses actual monthly cloud spend against the budget profile, broken down by service.
Step 4 – Define procedures and approve the plan
Priya documents where each base measure comes from, when it is extracted, and how it is checked. For example, the extraction script fails loudly if any team's board has items without size estimates, and the librarian logs every change to workflow states in the tracker. Criteria for evaluating the information products are defined in advance: each must be available within two working days of sprint end, and users will rate usefulness quarterly. The plan, about six pages plus the construct sheets, is approved by the sponsor.
Step 5 – Perform measurement
Data extraction is automated in the release manager's reporting pipeline. After sprint 4, the progress indicator turns amber: at the recent rate, the release would finish one sprint late. Figure 4 shows how the decision criteria turned that indicator into an action.
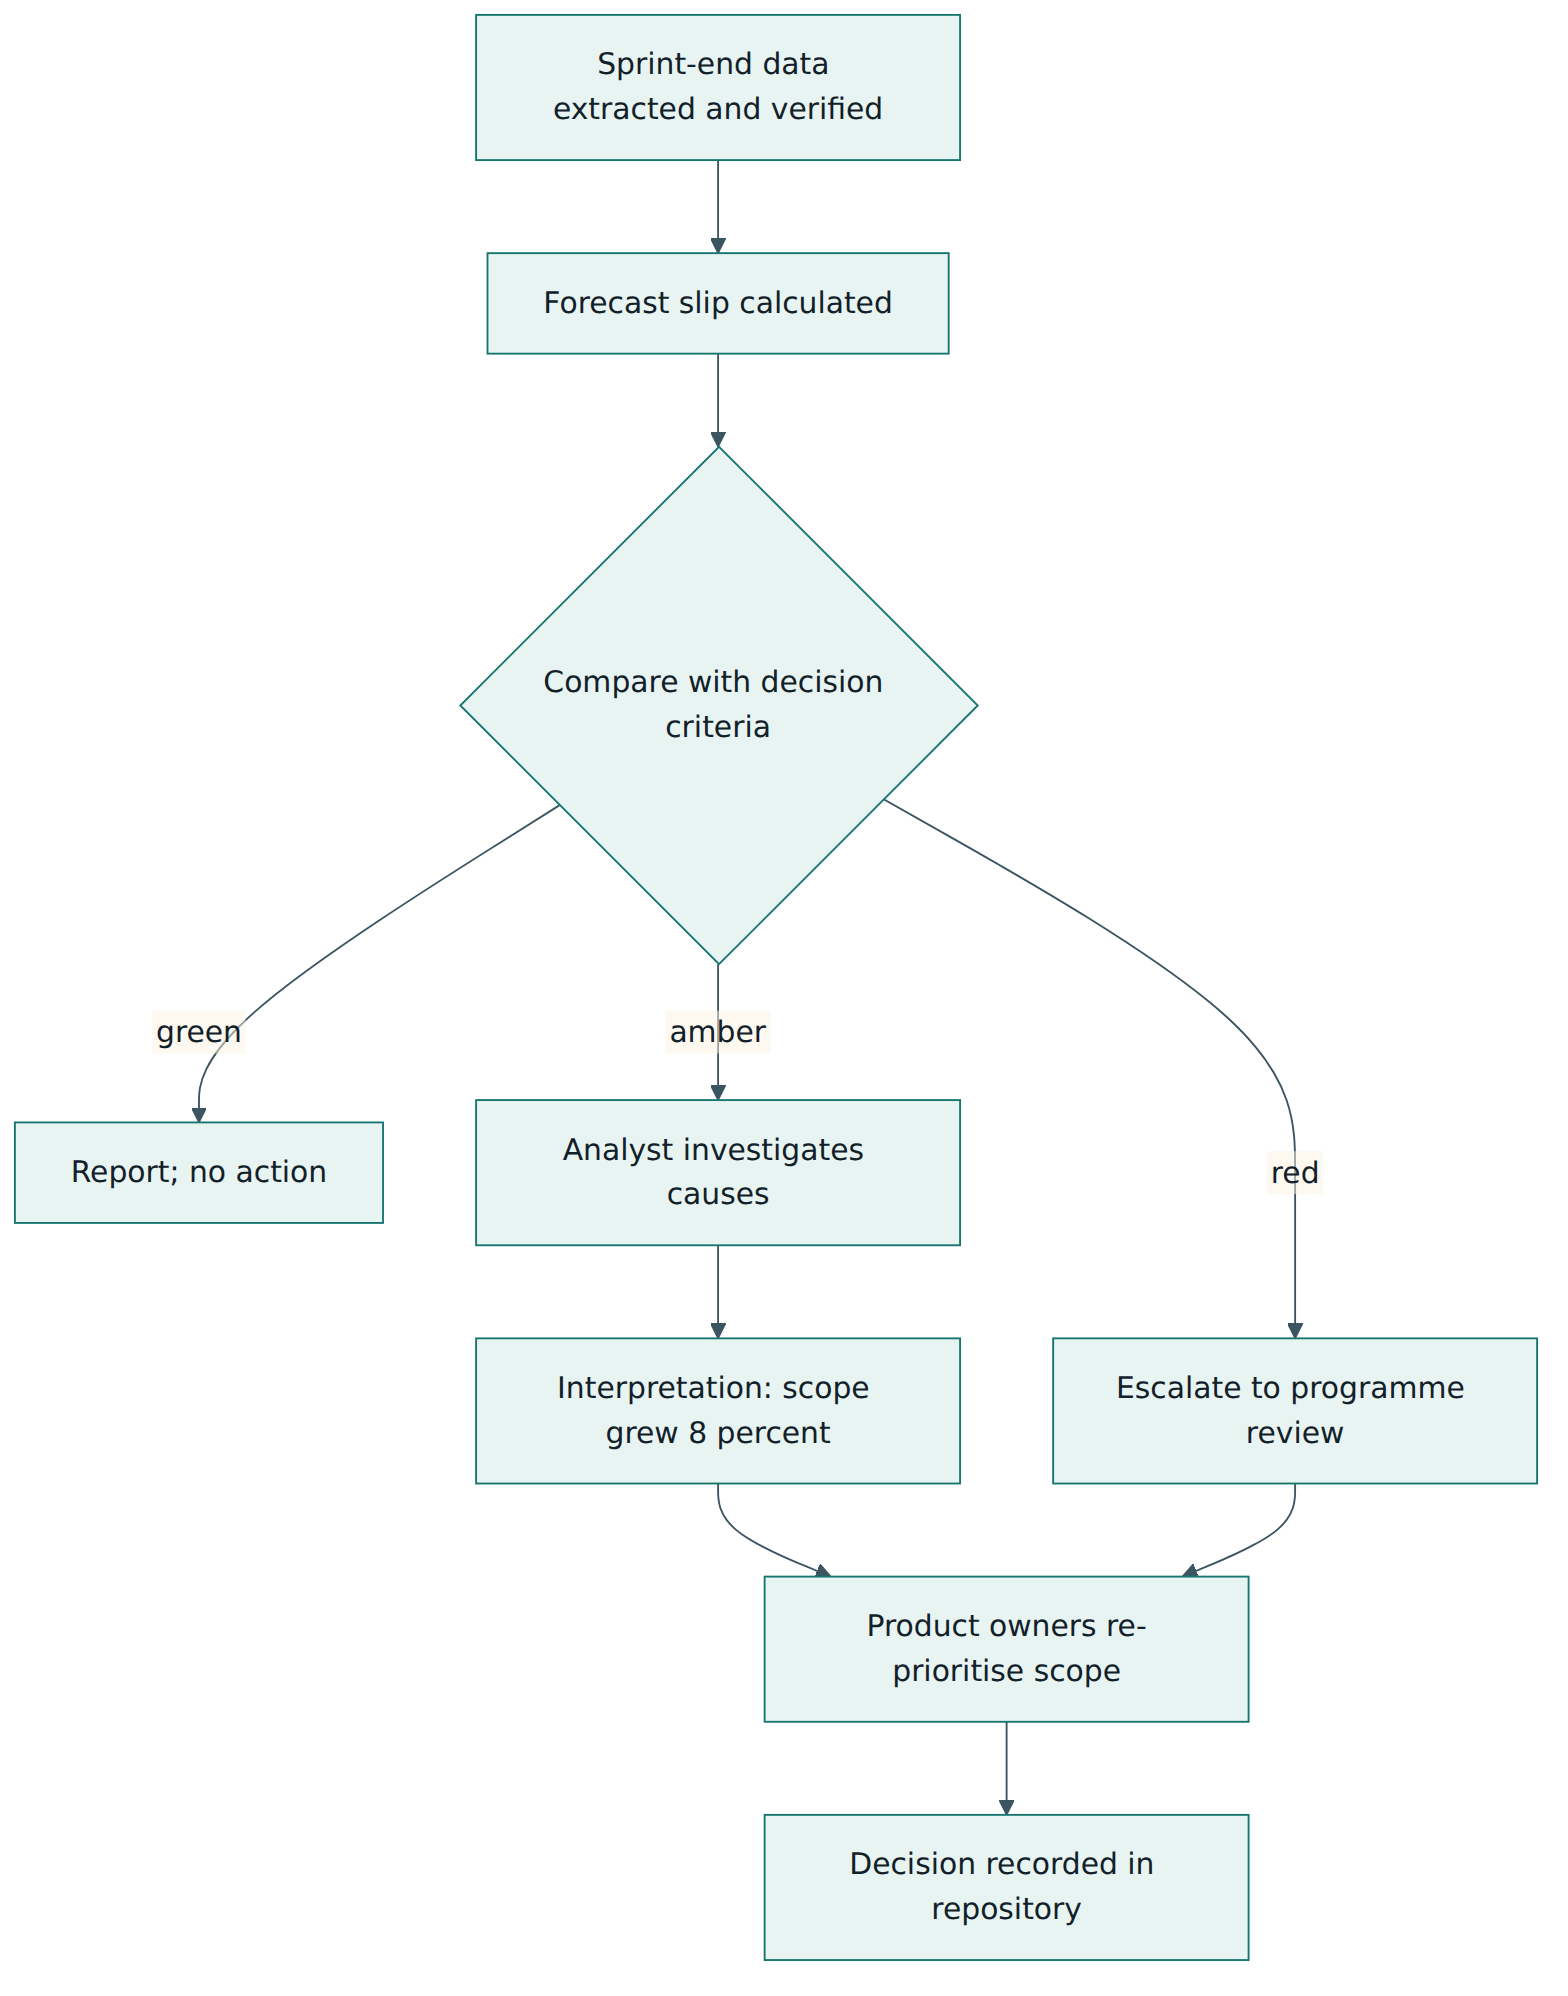
Priya's investigation shows that the velocity of the teams has been stable, but the committed scope has grown by 8 percent because new compliance items were added without re-planning. Her information product says exactly that, with the chart and two options: move two lower-value features to Release 4, or accept a one-sprint slip. The programme manager and product owners choose the first option, and the decision is recorded next to the indicator.
Step 6 – Evaluate and improve
At the end of the quarter, Priya runs an evaluation with the users. Findings: the progress indicator was used in every programme review and led to two scope decisions; the escaped-defects indicator was trusted only after the definition of "escaped" was clarified; the cloud cost information product arrived too late to be useful because the billing export runs monthly, so the team switches to daily cost exports; and one chart, average build time, was never used and is dropped. The lessons and three months of data are stored in the experience base. The next quarter's plan adds an information need about on-call load, which the teams themselves requested.
What the example shows
Every chart in Harbourline's reports can be traced to a named question and a named user. The decision criteria were agreed before the data arrived, so the amber signal led to calm analysis instead of blame. Interpretation, not the number alone, drove the decision. And the process improved itself: one measure was retired, one was fixed and one new need was added. That is the 15939 cycle in miniature.
Lesson 7 – Relationship to other standards and frameworks
ISO/IEC/IEEE 15939 rarely stands alone. It is the measurement "engine" that other standards and frameworks assume or reference. The table compares the most important neighbours.
| Standard or framework | What it is | Relationship to ISO/IEC/IEEE 15939 |
|---|---|---|
| ISO/IEC/IEEE 15288 and 12207 | System and software life cycle process standards | Each contains a short measurement process with a purpose and outcomes; 15939 elaborates that process in depth. |
| ISO/IEC 25020, 25022, 25023 (SQuaRE) | Quality measurement framework and quality measures for products and quality in use | Supply ready-made quality measures; 15939 supplies the process for selecting and using them against information needs. |
| ISO/IEC 330xx family | Process assessment framework (successor to ISO/IEC 15504) | Assesses process capability, including the measurement process; 15939 describes what a capable measurement process does. |
| CMMI | Capability and maturity model for improving performance | Its measurement practice area covers similar ground; organisations often use 15939 constructs to satisfy CMMI measurement practices. |
| ISO 9001 | Quality management system requirements | Requires monitoring, measurement, analysis and evaluation; 15939 offers a disciplined way to meet that for engineering work. |
| Practical Software and Systems Measurement (PSM) | Practitioner guidance on information-driven measurement | Historical source of many 15939 ideas; provides practical tables of common information categories and example measures. |
| Goal-Question-Metric (GQM) | Method for deriving measures from goals via questions | A technique for the planning activity; 15939 adds precise definitions, decision criteria and the evaluation loop. |
Life cycle standards
If your organisation has adopted 15288 or 12207 as its process reference, 15939 is the natural next step for measurement. The outcomes are consistent, the vocabulary is shared, and tailoring rules work the same way. When a contract says "the supplier shall perform the measurement process of ISO/IEC/IEEE 15288", 15939 tells both sides what that means in practice.
Quality measures
SQuaRE standards such as ISO/IEC 25023 define candidate measures for product quality characteristics like reliability or performance efficiency. They answer "what could we measure?" but not "what should this project measure and why?". 15939 answers the second question. A team that needs to know whether a service is reliable enough to release starts with that information need, then picks suitable reliability measures from the SQuaRE catalogue and specifies them as constructs with decision criteria.
Maturity models and improvement
Maturity models such as CMMI expect measurement to support management and improvement. As organisations mature, they move from measuring individual projects to building organisational baselines and statistical models of performance. The measurement experience base in 15939 is the foundation for that: historical data that has been evaluated and is trusted.
Delivery metrics and OKRs
Modern practices such as DORA delivery metrics, service level objectives or objectives and key results (OKRs) are not part of the standard, but they fit inside it. Each is essentially a set of candidate measures or targets. The standard asks the questions that keep them honest: which decision does this support, how exactly is it computed, what threshold triggers action, and is it still useful?
Common pitfalls and best practices
Common pitfalls
- Measuring what is easy instead of what is needed. Starting from available data rather than information needs produces many charts and few decisions.
- Searching for one "golden" set of measures. Each project and organisation has different needs. A core set can help consistency, but copying another organisation's dashboard rarely works.
- Treating measurement as a one-off set-up. Needs change as the project moves through its life cycle; a plan that is never revisited drifts out of date.
- Vague definitions. Without documented methods, scales and units, the same name hides different numbers and trends become meaningless when tools or workflows change.
- Using measures to rank or punish individuals. This invites gaming, destroys the honesty of the data and damages trust.
- Reporting numbers without interpretation. A red indicator with no explanation invites guesswork and blame instead of analysis.
- Never retiring measures. Unused measures still cost collection effort and distract attention from those that matter.
Best practices
- Trace every measure to an information need and a named user. If nobody can say what decision a measure supports, drop it.
- Write a construct for each measure. Specify entity, attribute, method, scale, unit, analysis model and decision criteria before collecting data.
- Agree decision criteria in advance. Thresholds agreed before the data arrives lead to calmer, faster decisions.
- Collect data as a by-product of work. Automate extraction from the tools people already use, and verify data as part of the procedure.
- Combine numbers with context. Pair quantitative indicators with qualitative insight from the people doing the work.
- Start small and grow. Begin with the few information needs that matter most to the sponsor and expand once they work.
- Evaluate regularly and keep history. Review usefulness with users, fix or retire weak measures, and store evaluated data in an experience base for future estimates.
Summary and key takeaways
- ISO/IEC/IEEE 15939:2017 is the current edition of the international measurement process standard for systems and software engineering; a second joint edition is at the draft (DIS) stage.
- The standard elaborates the measurement process described briefly in ISO/IEC/IEEE 15288 and 12207, and it is tailorable to any organisation size and life cycle model.
- Measurement starts from information needs of decision-makers, never from whatever data is available.
- The measurement information model links entities and attributes, through base and derived measures, to indicators, interpretations and information products.
- Four activities make up the process: establish and sustain commitment, prepare for measurement, perform and evaluate, with a measurement experience base that carries lessons forward.
- Decision criteria, agreed in advance, turn indicators into actions; interpretation adds the context numbers cannot show.
- There is no certification scheme; conformance is claimed and checked through contracts, internal audits, CMMI appraisals or ISO/IEC 330xx process assessments.
- Healthy measurement programmes evaluate themselves, retire unused measures and keep a small, trusted set.
Reflection questions
- List three charts or reports your team currently produces. For each, which information need does it address, who uses it, and what decision has it changed in the last three months?
- Pick one measure your organisation reports and write its full measurement construct. Which elements were you unable to fill in, and what does that tell you?
- Think of a measure that could be gamed if it became a target for individuals. How would you redesign the construct or the way it is used to reduce that risk?
- How would you fit the four activities of the measurement process into your team's existing rhythm of planning, reviews and retrospectives?
- If an acquirer asked you to demonstrate that your measurement process is consistent with ISO/IEC/IEEE 15939, what evidence would you show, and where are the gaps today?
Further reading and official sources
- ISO/IEC/IEEE 15939:2017 Systems and software engineering – Measurement process – ISO catalogue
- ISO/IEC/IEEE 15939:2017 – IEC webstore
- ISO/IEC/IEEE DIS 15939:2026-10 (revision in progress) – DIN Media
- ISO/IEC/IEEE DIS 15939 draft listing – Standard Norge
- Measurement – Guide to the Systems Engineering Body of Knowledge (SEBoK)
- Goal-Driven Software Measurement: A Guidebook – Carnegie Mellon University Software Engineering Institute
- CMMI – CMMI Institute (ISACA)
Original tutorial by xOps School (DevOpsSchool Private Limited), written from public sources about ISO/IEC/IEEE 15939. Not affiliated with or endorsed by the standard's owner; standard names are trademarks of their owners. Buy the official standard from its publisher for the authoritative text.