
DORA Software Delivery Performance Metrics – Tutorial (about 60 minutes)
- View
The DORA software delivery performance metrics are a small set of measures, drawn from more than a decade of research by the DevOps Research and Assessment (DORA) programme, that tell a team how quickly and how safely it gets changes into the hands of users. Engineering teams, platform groups, engineering managers and technology leaders use them to find bottlenecks, to check whether improvement work is paying off and to talk about delivery in a shared, evidence-based language. After this tutorial you will be able to define each of the five current metrics precisely, measure them for one service, interpret the results without falling into the classic traps, and link the numbers to the capabilities that actually move them.
Course overview
Edition and status: The DORA metrics are not a formal standard, so there is no ISO number, no numbered edition and no certification scheme. They are maintained by DORA, a research programme run by Google Cloud, and published free at dora.dev. The current definitions (the metrics guide on dora.dev, last updated 2026-01-05) describe five metrics in two groups: throughput (change lead time, deployment frequency, failed deployment recovery time) and instability (change fail rate, deployment rework rate). The fifth metric, deployment rework rate, was added in the 2024 research; the recovery metric was renamed from "time to restore service" (often called MTTR) in 2023. The most recent annual research report listed on dora.dev is the 2025 DORA Report: State of AI-assisted Software Development, published on 2025-09-23; no 2026 report was listed on the DORA research archive at the time of verification. Many articles and tools still describe "the four keys"; this tutorial teaches the current five-metric model and explains how it grew out of the four. Verified 2026-10-29.
Who it is for: software engineers, operations and site reliability engineers, platform and DevOps engineers, engineering managers, delivery and product leads, and quality, risk or audit people who are asked to read or report delivery metrics. No background in statistics or DevOps research is assumed.
Prerequisites: none. It helps to know roughly how code moves from a developer's laptop into production in your organisation (version control, a build, some form of deployment), because every metric is measured somewhere along that path.
How to use this tutorial: read the seven lessons in order (about 45 minutes), study the five diagrams, then use the remaining time on the reflection questions before you take the 25-question knowledge check.
Learning objectives:
- You will be able to explain where the DORA metrics come from, what research question they answer and why speed and stability are measured together.
- You will be able to define change lead time, deployment frequency, failed deployment recovery time, change fail rate and deployment rework rate, including where each measurement starts and stops.
- You will be able to describe how the metrics fit into the DORA Core model of capabilities, performance and outcomes.
- You will be able to set up a first measurement for one service, from conversations and the Quick Check to automated data from delivery tools.
- You will be able to interpret results honestly: use trends instead of league tables, avoid turning metrics into targets and recognise gaming.
- You will be able to run an improvement loop that links a weak metric to a capability such as test automation or small batches.
- You will be able to relate the DORA metrics to SRE service level objectives, the SPACE framework, the Flow Framework and Kanban flow metrics.
Lesson 1 – Origins, purpose and scope
The question behind the metrics
For years, software organisations argued about delivery from opinion. One camp said that moving fast meant breaking things, so releases should be rare, large and heavily approved. Another camp said that frequent small releases were safer. Each side had stories, but nobody had good data across many organisations. The DORA research set out to answer a measurable question: what does high software delivery performance look like, and which practices, technologies and cultural traits predict it?
To answer that question the researchers needed a way to measure delivery performance that worked for any kind of software, in any industry, without depending on a particular tool. They chose outcome measures of the delivery system rather than activity measures of people. Lines of code, story points, number of commits and hours worked were rejected because they are easy to inflate, they say nothing about whether users received value, and they invite comparisons between individuals. Instead the researchers looked at how long changes take to reach production, how often the team deploys, how often a deployment goes wrong and how quickly the team recovers when it does.
A short history
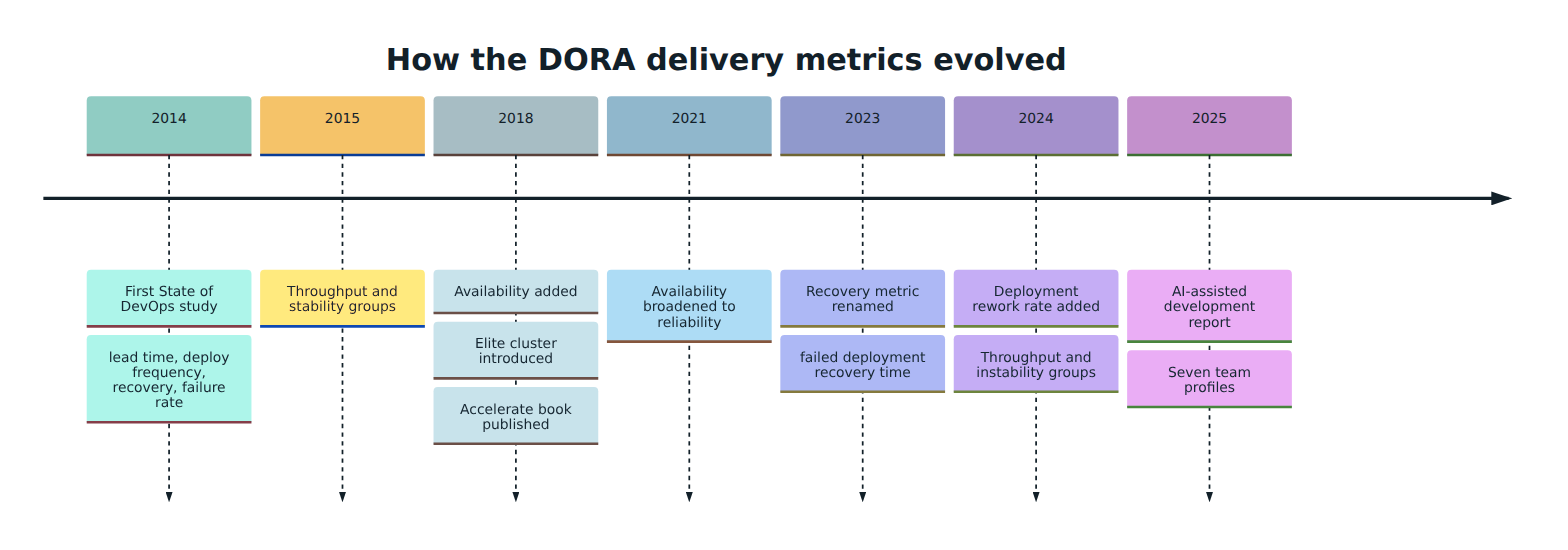
The research began in 2014 as part of the annual State of DevOps Report, at first produced together with Puppet. It was led by Dr Nicole Forsgren, with Jez Humble and Gene Kim. DORA later operated as an independent research company and was acquired by Google Cloud in 2018, the same year the three authors published the book Accelerate: The Science of Lean Software and DevOps, which explained the research design and findings for a general audience. Since then, Google Cloud has run DORA as a research programme and published a report almost every year, together with free guides at dora.dev.
The metrics themselves have evolved. The first study looked at four variables. By 2015 the model had settled into two groups: throughput (how fast changes flow) and stability (how reliably they land). In 2018 the research added availability as an operational measure, later broadened in 2021 to reliability. In 2023 the recovery metric was narrowed and renamed so that it only covers failures caused by a change. In 2024 a fifth metric, deployment rework rate, was introduced, and the five metrics were regrouped into throughput and instability. The 2025 report focused on AI-assisted development and described teams through seven profiles that combine delivery performance with well-being and product outcomes.
The central finding: speed and stability go together
The most quoted result of the research is that throughput and stability are not a trade-off. Across years of survey data, the teams that deployed most often and with the shortest lead times also tended to have the lowest failure rates and the fastest recovery. Teams that deployed rarely did not gain safety in exchange; they tended to be slow and less stable. The explanation is practical: small, frequent changes are easier to test, review, deploy, understand and undo than large, infrequent ones. This finding is why the metrics are always used as a set. A team that optimises speed alone may simply push risk into production; a team that optimises stability alone may freeze change and slowly fall behind its users.
Scope: what the metrics do and do not cover
The metrics describe the software delivery part of the value stream: from the moment a change is committed to version control until it runs in production, plus what happens when a deployment fails. They do not measure product discovery, the quality of ideas, user satisfaction, revenue, cost or developer happiness. DORA studies those things too, as outcomes and as conditions, but separately. The metrics also apply to a single application or service at a time. They are a lens for a team to look at its own delivery system, not a scorecard for comparing unrelated systems or ranking people.
Lesson 2 – Key concepts and vocabulary
Precise words matter here, because most disagreements about DORA numbers turn out to be disagreements about definitions. Learn these terms before you look at any dashboard.
- Change – any modification to the software or its configuration that is committed to version control: new code, a bug fix, an infrastructure definition, a configuration value or a database migration script.
- Deployment – the act of putting one or more changes into the production environment so that they can serve users. Each team must write down what counts as a deployment for its service, because DORA does not prescribe it.
- Production – the environment that real users or customers depend on. A deployment to a test or staging environment is not a production deployment.
- Change lead time – the time from a change being committed to version control until that change is running in production.
- Deployment frequency – how often the team deploys to production, expressed either as a count over a period or as the typical time between deployments.
- Failed deployment – a production deployment that degrades the service and needs immediate intervention, such as a rollback, a hotfix, a fix-forward or switching a feature flag off.
- Failed deployment recovery time – how long it takes to restore normal service after a failed deployment. It replaced the older, broader "time to restore service" or MTTR.
- Change fail rate – the proportion of production deployments that turn out to be failed deployments. Older sources call it change failure rate.
- Deployment rework rate – the proportion of production deployments that were not planned but had to be made because of an incident in production.
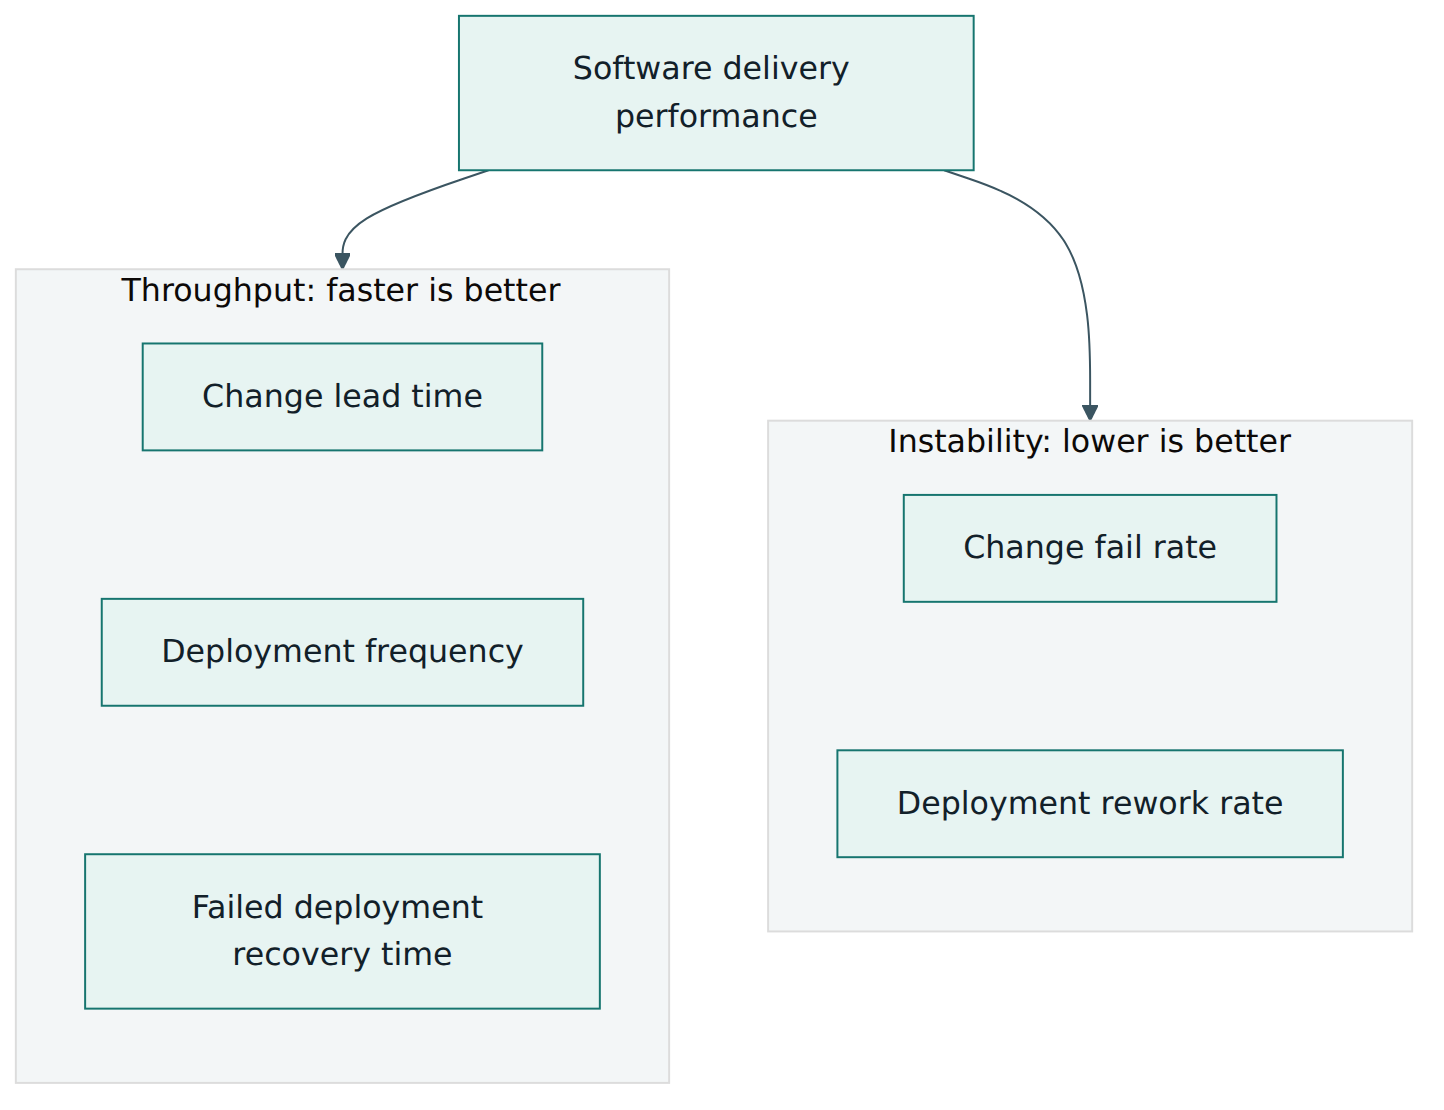
- Throughput – the group of metrics that describe how quickly and how often change flows to users: change lead time, deployment frequency and failed deployment recovery time.
- Instability – the group of metrics that describe how often change causes trouble: change fail rate and deployment rework rate. Lower is better.
- Capability – a practice or condition, technical, process-related or cultural, that the research found to predict better performance, for example continuous integration or a generative culture.
- Batch size – the amount of change that travels together through the pipeline and into one deployment. Smaller batches are a recurring theme of the research.
- Leading and lagging indicators – a leading indicator changes before the outcome you care about, a lagging one changes after. DORA describes the delivery metrics as leading indicators of organisational performance and well-being, and as lagging indicators of the practices a team adopts.
- Goodhart's law – the observation that a measure which becomes a target stops being a good measure, because people change their behaviour to hit the number.
Why the recovery metric was renamed
The old measure, mean time to restore (MTTR), mixed very different events: a data centre losing power, a third-party API outage and a bad release all counted the same. Teams could do little through their delivery practices about the first two. The 2023 change narrowed the metric to failures caused by the team's own deployments. That makes it a true delivery measure: it shows how good the team is at detecting a bad change and getting back to a healthy state, which depends on things the team controls, such as monitoring, rollback automation and small changes. Wider reliability is still important, but it is tracked elsewhere, for example with service level objectives.
Why rework rate was added
For years change fail rate was the only instability measure, and it was used partly as a stand-in for how much rework a team had to do. Already in the first study it had fitted the statistical model less neatly than the other measures. The 2024 research added deployment rework rate to test whether that stand-in was good enough, by asking a closely related question from a different angle: instead of asking "how many deployments failed?", it asks "how many of our deployments were unplanned repairs?". A team that ships ten planned changes in a week and then needs four emergency fixes has a rework problem even if all four fixes trace back to a single failed deployment. Together the two metrics give a fuller picture of instability.
Lesson 3 – Structure of the metrics and the DORA model
The five metrics in two groups
The current model arranges the five metrics into two factors. Throughput answers "how fast can we move a change to users and get back on our feet when something goes wrong?". Instability answers "how often does a change hurt us?". Placing recovery time under throughput surprises many people, because it sounds like a stability measure. DORA's history of the metrics explains that the 2023 redefinition, which limited the metric to failures caused by a change, aligned it statistically with the other delivery measures, and the 2024 research then grouped it with lead time and deployment frequency. One way to understand this: recovering from a failed deployment usually means pushing another change, whether a rollback or a fix, so a team with a fast, automated path to production tends to recover fast for the same reasons it delivers fast.
Where each measurement starts and stops
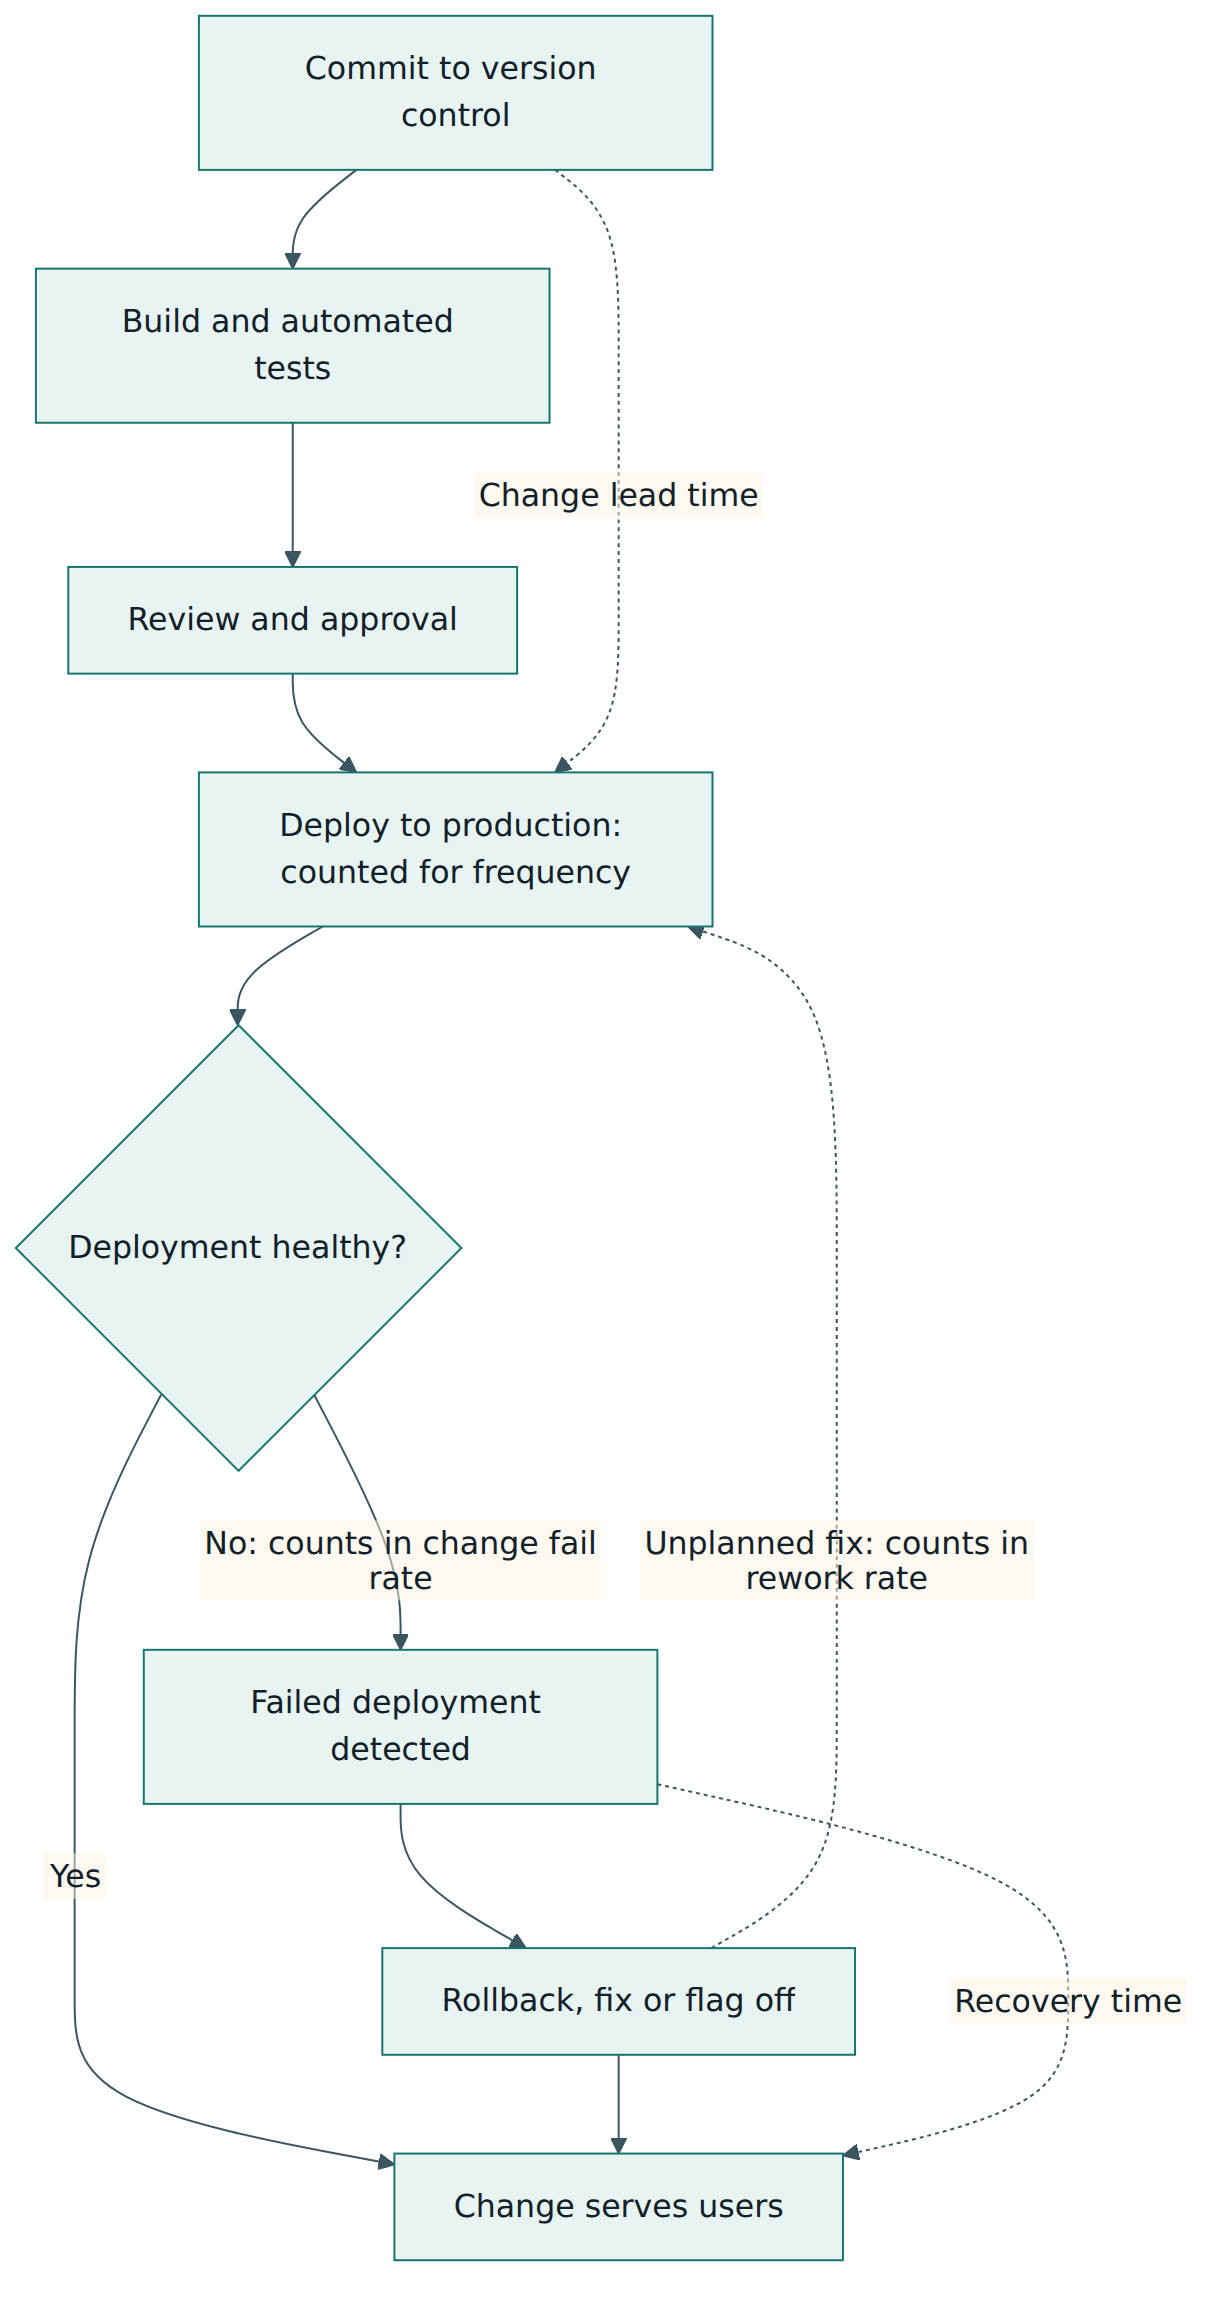
The metrics become concrete once you place them on the delivery path. Change lead time starts at the commit and stops when the change is live in production; it includes waiting for review, waiting in a build queue, waiting for an approval board and waiting for a deployment window. Deployment frequency is counted at the production deployment step. When a deployment fails, the clock for failed deployment recovery time starts at the moment the failure begins (or, in practice, when it is detected, if that is all you can record) and stops when the service is healthy again. Change fail rate divides the number of failed deployments by the number of deployments. Deployment rework rate divides the number of unplanned, incident-driven deployments by the number of deployments.
Units and summary statistics
DORA's survey asks respondents to choose from ranges, such as "between one day and one week" for lead time or "between once per week and once per month" for deployment frequency, because people answer ranges more reliably than exact figures. When you measure from your own tools you get exact timestamps, and you then need to choose a summary. A median is usually better than a mean for lead time and recovery time, because a single forgotten branch that waited three months can drag the average far away from the typical experience. Many teams also track a high percentile, such as the 85th or 90th, to see the long tail. Rates are simple proportions over a window, such as the last 30 or 90 days. Whatever you choose, keep it stable over time so that trends are meaningful.
The metrics inside the DORA Core model
The metrics are not the whole of DORA. The programme publishes the DORA Core model, a slow-changing summary of its most established findings. In simplified form, it says that capabilities predict software delivery performance, and that delivery performance in turn predicts outcomes such as organisational performance and the well-being of the people doing the work. Capabilities are things a team can adopt or improve. DORA's capability catalogue includes, among others, continuous integration, continuous delivery, deployment automation, test automation, trunk-based development, version control, working in small batches, loosely coupled teams, monitoring and observability, streamlining change approval, database change management, documentation quality, generative organisational culture, transformational leadership, platform engineering and a user-centric focus.
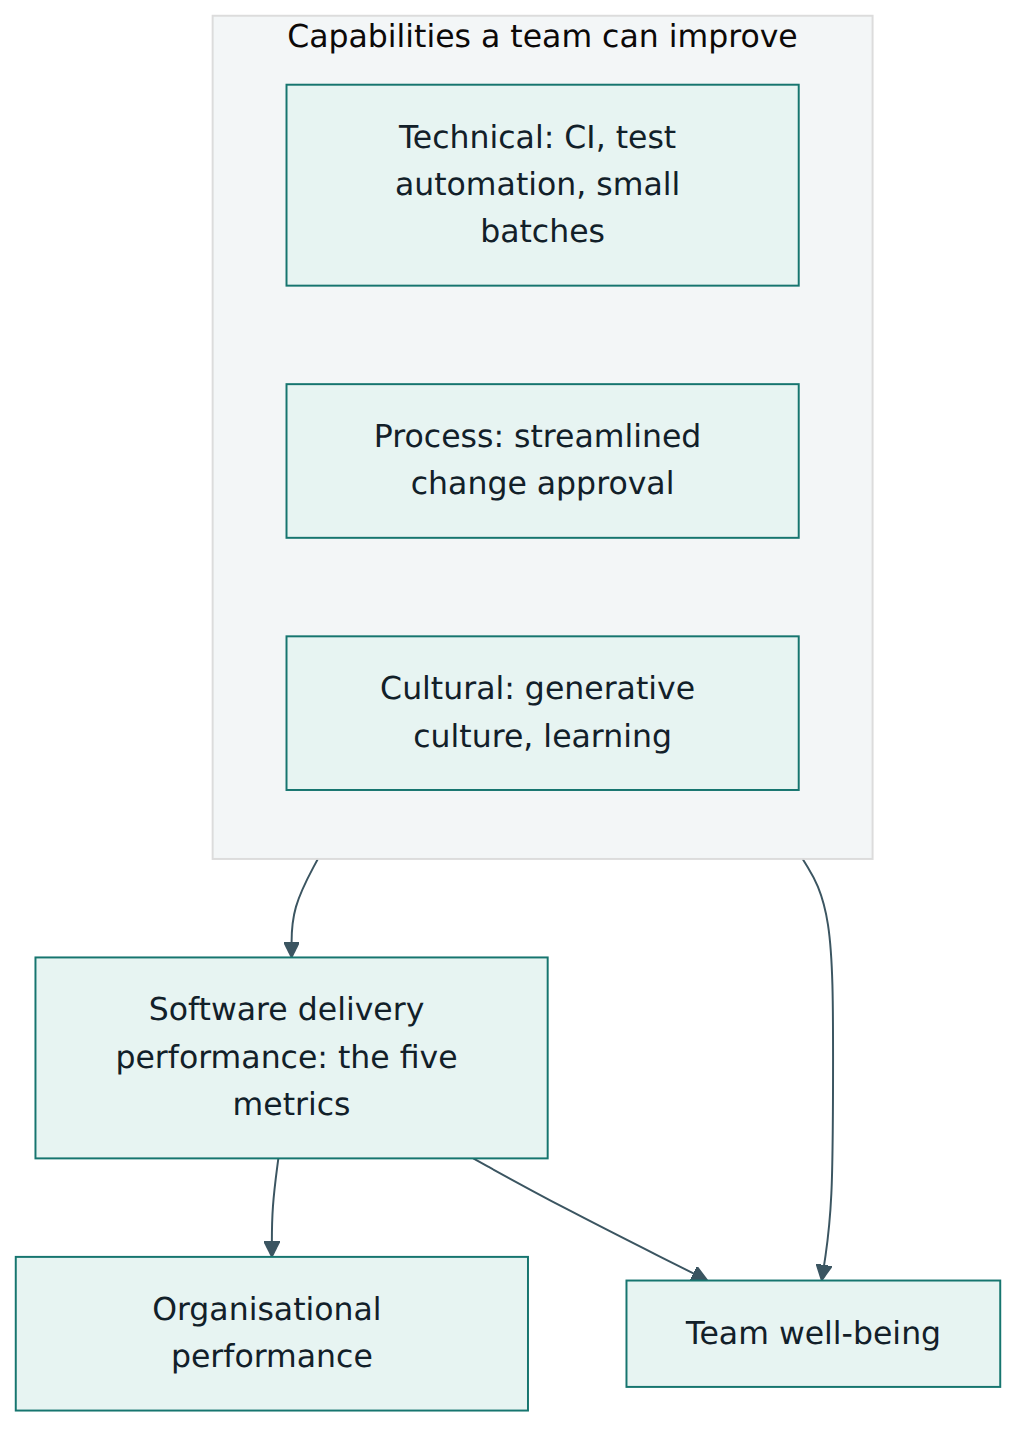
This structure is the key to using the metrics well. The metrics tell you where the delivery system is weak; the capabilities tell you what to work on. A long lead time caused by a weekly change advisory board points at streamlining change approval. A high change fail rate with slow recovery points at test automation, deployment automation and monitoring. Reading the numbers without the capability model leads to blind pressure on teams; reading the capabilities without the numbers leads to adopting practices with no way to tell whether they helped.
Performance levels and team profiles
Up to 2024 the annual reports grouped survey respondents into performance clusters, using statistical clustering of the answers: at first high, medium and low, with an elite cluster added in 2018 (most later reports used elite, high, medium and low). The top clusters typically deployed on demand, many times a day, with lead times and recovery measured in hours, while the lowest clusters deployed monthly or less often with lead times of months. The cluster boundaries and their share of respondents were recalculated each year from that year's data, so they are snapshots of one survey population, not fixed grades. The 2025 report described seven team profiles that combine delivery performance with friction, burnout and product outcomes, ranging from teams facing foundational challenges to harmonious high achievers. Treat any benchmark as context for a conversation, never as a pass mark.
Lesson 4 – How it works in practice
Step 1: choose one service and agree definitions
Start with a single application or service that a single team owns and deploys. Mixing several services into one number hides the signal, because a fast microservice and a slow legacy system average into something that describes neither. Then the team writes down, in plain language, its local definitions: what counts as a deployment (for example, a new version reaching all production instances, or reaching the first canary?), what counts as a failed deployment (for example, any deployment followed by a rollback, a hotfix within 24 hours or a severity 1 or 2 incident linked to it), what counts as recovered and which timestamp marks the start of lead time when work is squashed or rebased. Write these definitions into the team's documentation so that they survive staff changes.
Step 2: get a baseline the cheap way
DORA's own guidance is to start simple. Before building any pipeline integration, the team can answer the questions in the DORA Quick Check on dora.dev, a short web questionnaire of five multiple-choice questions that places the team against the research data and suggests capabilities to look at. It does not store answers. Alternatively, run a one-hour conversation: "When did our last few changes get committed, and when did they reach users? How many deployments did we make last month? Which ones went wrong, and how long did each take to fix?". Rough answers are enough to see the biggest problem. Teams that start by building a perfect dashboard often spend months on plumbing and never get to improvement.
Step 3: automate the measurement where it pays
When the team wants continuous data, it can collect events from the systems it already uses. Version control provides commit timestamps. The CI/CD system provides deployment events with the commits each deployment contains. The incident management or on-call tool provides failure start and resolution times, ideally linked to the deployment that caused them. A simple data model with three tables, changes, deployments and incidents, is enough to compute all five metrics. Google's open-source Four Keys project showed this pattern on Google Cloud, collecting events from GitHub or Cloud Build into a data warehouse with a dashboard on top; it was archived in January 2024 and is no longer maintained, but its design is still a useful reference. Many commercial engineering-analytics and CI/CD products now offer DORA dashboards; check exactly how each one defines its metrics before trusting the numbers.
Step 4: make the numbers visible and shared
The metrics work best when development, operations and release people share all five of them. If developers own lead time and operations own change fail rate, each group can improve its number at the other's expense and the conversation turns into finger-pointing. Put the metrics on a team-level page, show trends over weeks or months rather than single values, and review them in a regular meeting such as a retrospective or a monthly service review.
Step 5: run the improvement loop
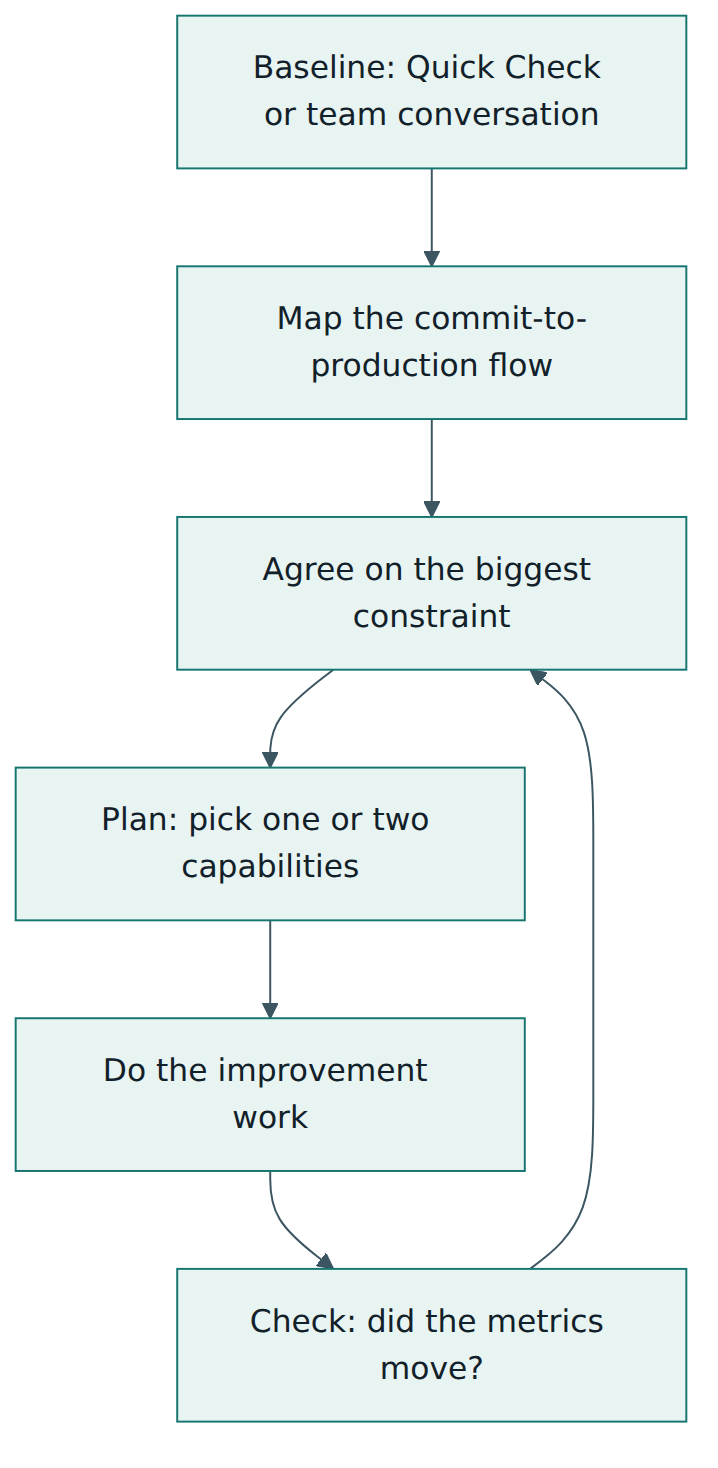
DORA recommends a repeating loop. Establish a baseline. Map the delivery process from commit to production, ideally as a value stream map that shows where work waits. Agree as a team on the biggest constraint. Make a small plan to address it with one or two capabilities. Do the work. Check the metrics again to see whether they moved in the expected direction, then pick the next constraint. The loop is deliberately modest: one bottleneck at a time, measured, then repeated.
Roles and artefacts
DORA does not define formal roles, but in practice a few appear. The team owns its metrics and decides on improvements. A platform or DevOps enablement group often provides the data collection and dashboards for many teams, as a service rather than a control function. Engineering leadership uses aggregated trends to decide where to invest, for example in a shared test environment or a better deployment platform, without ranking teams against each other. Typical artefacts are the written metric definitions, a dashboard per service, a value stream map, and a short improvement log that records which constraint was tackled and what happened to the numbers.
Reading the metrics together
Each pattern across the five metrics tells a story. Long lead time with low deployment frequency usually means large batches and manual gates. Frequent deployments with a rising change fail rate suggest that automated testing has not kept pace with speed. A low change fail rate with very long recovery time suggests the team rarely fails but is poorly prepared when it does, perhaps with no rollback path. A high rework rate with a modest change fail rate can mean that problems surface slowly, after the deployment has been declared successful, and the team keeps shipping unplanned repairs. Because the five metrics constrain each other, it is much harder to game all of them at once than to game one.
Lesson 5 – Assessment, benchmarking and compliance
There is no DORA certification
DORA metrics are a research-based measurement framework, not a certifiable standard. Google Cloud does not audit or certify organisations as "elite", and no accredited body issues DORA conformity certificates. Training providers offer courses on the metrics, and some vendors award their own badges, but these are not DORA certifications. If someone claims their organisation is "DORA certified", ask what that means in practice. Note also a naming clash: the European Union's Digital Operational Resilience Act for the financial sector is also abbreviated DORA. It is a binding regulation about ICT risk and resilience and has nothing to do with these delivery metrics, although a bank might use both.
Ways to assess delivery performance
There are three common ways to assess a team's performance with the metrics, and they complement each other.
- Self-assessment with the Quick Check – quick, free and comparable with the research population, but based on perception and on ranges.
- Survey-based assessment inside an organisation – some organisations run their own DORA-style survey across many teams, which also captures capabilities, culture and well-being. This needs careful question design and anonymity to be honest.
- System-based measurement – data from version control, pipelines and incident tools. It is precise and continuous, but only as good as the definitions and the linking of incidents to deployments.
When survey answers and system data disagree, treat that as useful information. Engineers who say lead time is "about a week" when the system shows two days may be thinking of the time from ticket creation, not from commit, which is a sign that the waiting happens before coding starts and is outside what lead time measures.
Benchmarks: useful context, poor targets
The published clusters are tempting to turn into goals: "every team must be elite by next year". DORA advises against this. The clusters come from a self-selected population of survey respondents, they shift from year to year, and they do not account for the context of a particular system. A firmware team that ships to devices in the field cannot deploy on demand in the same way as a web team, and that is not a failure. The meaningful comparison is a team with its own past: is our lead time shorter than last quarter, and is our change fail rate stable or falling while we speed up? DORA's guidance also warns against the opposite mistake: using the industry you work in, or its regulation, as a reason not to improve at all.
Using the metrics in governance and audit
Quality, risk and audit functions increasingly see DORA metrics in management reports. They can be useful evidence: a low change fail rate with fast recovery is evidence that change risk is being managed, and trends support the argument for lighter-weight change approval based on automated checks rather than meetings. The research found that heavyweight external change approval was associated with slower delivery without making it more stable. Auditors should check that the definitions are written down, that data collection is complete (for example, emergency changes made outside the pipeline are also counted), and that the numbers are not being used to judge individuals. A metric in an audit report is only as trustworthy as the way it was collected.
Ethics and privacy
The metrics describe a delivery system, so they should be reported per service or team. Breaking them down to individual developers invites the very behaviours that destroy their value: people avoid risky but necessary changes, split work artificially or hide incidents. Where data comes from personal accounts in version control, follow your organisation's privacy rules and aggregate before you publish.
Lesson 6 – Worked example
The organisation
Harbourline Logistics (a fictional company) runs a customer-facing shipment-tracking service. One team of eight people builds and runs it. Leadership has complained that new features take "forever" and that releases often break something. The engineering manager, Amara, decides to use the DORA metrics to replace complaints with evidence.
Step 1: definitions
The team agrees on local definitions in a one-hour workshop. A deployment is a new version of the tracking service reaching all production regions. A failed deployment is any deployment that is rolled back, followed by an emergency fix within 48 hours, or linked to a priority 1 or 2 incident. Recovery is reached when the incident is resolved and error rates are back to normal. An unplanned deployment for rework is any deployment created to fix a production incident rather than from the planned backlog. Lead time starts at the first commit of a change that is merged to the main branch.
Step 2: baseline
The team first answers the Quick Check together, then pulls three months of data by hand from its Git hosting, its deployment tool and its incident tracker. The illustrative baseline looks like this:
| Metric | Baseline (last 90 days) | What the team notices |
|---|---|---|
| Change lead time | Median 19 days | Most of it is waiting for the fortnightly release train and a manual test phase. |
| Deployment frequency | 6 deployments, plus 5 emergency fixes | Planned releases are large and bundle many changes. |
| Failed deployment recovery time | Median 7 hours | Rollback is manual and nobody is sure which change caused the problem. |
| Change fail rate | 4 of 11 deployments (about 36 %) | Big releases mix many changes, so one defect fails the whole release. |
| Deployment rework rate | 5 of 11 deployments (about 45 %) | Almost half of all deployments are unplanned repairs. |
Notice two things. First, the emergency fixes count as deployments, so they appear in the denominator of both rates. Second, rework rate is higher than change fail rate because one bad release needed two separate emergency fixes. That detail would be invisible with change fail rate alone.
Step 3: find the constraint
The team draws a value stream map. A typical change is coded and reviewed in two days, then waits about nine days for the next release train, then spends four days in a manual regression test with a shared test team, then waits for a change advisory board that meets weekly. Very little of the 19 days is actual work. The team agrees that the biggest constraint is the large batch created by the release train and manual testing: it slows delivery and also makes each deployment risky.
Step 4: plan and improve
The team chooses two capabilities from the DORA catalogue: test automation and working in small batches. Over two months it automates the regression checks that catch the most common defects, adds them to the pipeline, and switches from a fortnightly train to deploying whenever a change passes the pipeline, using feature flags to hide unfinished features. In parallel Amara works with the risk team to replace the weekly board for routine changes with an automated record of tests, reviews and approvals, keeping a human review for high-risk changes. The team also scripts the rollback, so that reverting a version takes one command.
Step 5: check
Three months later the team repeats the measurement with the same definitions. The illustrative results: median lead time is down to two days; the team deploys most working days; change fail rate has fallen to roughly one in ten deployments; median recovery time is under an hour because rollback is automated and each deployment contains only one or two changes; rework rate has fallen in line. Throughput went up and instability went down at the same time, which is the pattern the research predicts when batch size shrinks.
What Amara reports, and what she does not
Amara reports trends for the service, the capabilities adopted and the next constraint the team has chosen (slow database migrations). She does not compare the team with the warehouse-systems team, whose system and constraints are different, and she refuses a request to set "elite by Q4" as a bonus target, explaining that it would invite gaming such as splitting one change into several deployments to raise frequency or relabelling failures as planned work. Instead, leadership agrees to fund the next improvement and to review trends quarterly.
Lessons from the example
The example shows the full chain of reasoning: definitions first, a cheap baseline, a map to find where time is lost, capabilities chosen to address the constraint, and the same metrics used to check the result. It also shows why the metrics must be read together. If the team had only pushed deployment frequency up without test automation and rollback, it would probably have raised its change fail rate and rework rate, and leadership would have concluded, wrongly, that speed causes instability.
Lesson 7 – Relationship to other standards and frameworks
The DORA metrics are often used alongside other frameworks. Knowing the boundaries helps you pick the right tool for each question and avoid treating any one framework as the complete picture.
| Framework | What it measures or provides | How it relates to the DORA metrics |
|---|---|---|
| Site Reliability Engineering (SLOs and error budgets) | Reliability from the user's point of view through service level indicators, objectives and error budgets. | Covers overall operational reliability, which DORA tracks separately from delivery. Error budgets can decide how much change risk a team may take; the DORA metrics show how safely changes are delivered. |
| SPACE framework | Developer productivity across satisfaction and well-being, performance, activity, communication and collaboration, and efficiency and flow. | Broader and people-focused; co-authored by Nicole Forsgren. DORA metrics can serve as performance and flow measures inside a SPACE-style set, but SPACE warns against relying on activity counts alone. |
| Flow Framework (Mik Kersten) | Flow of business value across the whole value stream: flow velocity, time, efficiency, load and distribution by work type. | Starts earlier than commit, at the request or idea. Useful when the delay sits in planning or prioritisation, which change lead time does not see. |
| Kanban Method flow metrics | Lead time from commitment to delivery, throughput, work in progress and their relationship through Little's Law. | Kanban lead time usually starts at the commitment point, not at the commit; DORA's capability catalogue includes work in process limits and visual management. |
| ITIL 4 change enablement | Practices for assessing, authorising and scheduling changes in IT services. | DORA research supports lightweight, automated change approval. ITIL 4 allows standard pre-authorised changes, which fits a high-throughput pipeline when combined with automated evidence. |
| Value stream management and mapping | A Lean method to visualise steps, waiting time and handoffs from request to value. | The tool DORA recommends for finding the constraint behind a poor lead time; it explains the numbers the metrics report. |
Choosing between them
Use DORA metrics when the question is "how well does our path from commit to production work?". Use SLOs when the question is "is the service reliable enough for users right now?". Use SPACE or a developer experience survey when the question is "how productive and healthy is the engineering organisation?". Use flow or value stream measures when the question is "why do ideas take so long to become features at all?". These questions overlap, and many organisations use a small combination: the five DORA metrics per service, a few SLOs per user journey, and a periodic developer survey.
DORA metrics and the EU Digital Operational Resilience Act
As mentioned in Lesson 5, the acronyms collide. The regulation, which has applied to financial entities in the European Union since January 2025, requires ICT risk management, incident reporting, resilience testing and oversight of third-party providers. A bank subject to that regulation might still use delivery metrics to show that its change process is controlled and recoverable, but nothing in the regulation mandates the DORA software delivery metrics, and the research programme is unrelated to it. When you read "DORA" in a document, check which one is meant.
Common pitfalls and best practices
Common pitfalls:
- Turning the metrics into targets or bonus criteria, which leads to gaming: deployments split artificially, failures relabelled, incidents not linked to the change that caused them.
- Focusing on a single metric, typically deployment frequency, and ignoring the instability metrics that would show the cost of going faster.
- Ranking teams or individuals against each other, even when their systems, users and constraints are completely different.
- Blending many services into one organisation-wide number that hides where the real problems are.
- Leaving definitions implicit, so that the numbers change whenever a tool or a person changes.
- Using means instead of medians for time measures, so a few outliers distort the picture.
- Spending months building dashboards before having a single improvement conversation.
- Assuming the metrics cover everything; they ignore discovery, product value and developer well-being, which need other measures.
Best practices:
- Measure one service at a time and write the local definitions of deployment, failure and recovery down.
- Always look at all five metrics together, and at trends over time rather than single values.
- Start with the Quick Check or a team conversation; automate data collection only when the team is ready to act on it.
- Make development, operations and release staff share ownership of all five metrics.
- Connect every weak metric to a capability, improve one constraint at a time and measure again.
- Reduce batch size: smaller changes improve both throughput and stability.
- Count every production change, including emergency fixes made outside the normal pipeline.
- Use benchmarks only as context for discussion and compare each team with its own past.
Summary and key takeaways
- The DORA metrics come from the DevOps Research and Assessment programme, now run by Google Cloud, which has studied software delivery since 2014.
- Five metrics are current: change lead time, deployment frequency and failed deployment recovery time (throughput); change fail rate and deployment rework rate (instability).
- Speed and stability are not a trade-off: in the research, the fastest teams were also the most stable, largely because they ship small changes.
- The metrics sit inside the DORA Core model: capabilities predict delivery performance, which predicts organisational performance and well-being.
- Measure per service, with written local definitions and robust summaries such as medians; start simple and automate later.
- There is no certification; benchmarks are snapshots of a survey population, useful as context and harmful as targets.
- Use the improvement loop: baseline, map the flow, pick the constraint, improve a capability, check the metrics, repeat.
- Combine the metrics with SLOs, developer experience and flow measures for a complete view, and do not confuse them with the EU regulation of the same acronym.
Reflection questions
- For a service you know, how would you define a deployment, a failed deployment and recovery, and which edge cases (canaries, feature flags, configuration changes) would you need to decide on?
- Where in your own commit-to-production path do changes wait the longest, and which DORA capability would address that wait?
- If your leadership asked to rank all teams by deployment frequency, what would you say, and what would you offer instead?
- Think of a recent production problem caused by a release. How long did recovery take, and what would have made it faster: detection, diagnosis or the mechanics of rolling back?
- Which other measures (SLOs, developer surveys, flow metrics) would your organisation need alongside the five DORA metrics to answer its most important questions?
Further reading and official sources
- DORA's software delivery performance metrics – DORA (Google Cloud)
- A history of DORA's software delivery metrics – DORA (Google Cloud)
- DORA capabilities catalogue – DORA (Google Cloud)
- DORA Quick Check – DORA (Google Cloud)
- State of AI-assisted Software Development 2025 – DORA (Google Cloud)
- Announcing the 2025 DORA Report – Google Cloud Blog
- Four Keys (archived reference implementation) – DORA team on GitHub
- Accelerate: The Science of Lean Software and DevOps – IT Revolution
Original tutorial by xOps School (DevOpsSchool Private Limited), written from public sources about DORA Software Delivery Performance Metrics. Not affiliated with or endorsed by the standard's owner; standard names are trademarks of their owners. Buy the official standard from its publisher for the authoritative text.