
ISO 14064-1 – Tutorial (about 60 minutes)
- View
ISO 14064-1 is the international standard that tells an organisation how to build a greenhouse gas (GHG) inventory: how to decide what to include, how to quantify emissions and removals, how to manage data quality, and how to report the result so that it can be checked by an independent verifier. Companies, public bodies, universities, hospitals and their suppliers use it to produce carbon figures that customers, investors, lenders and regulators can trust. After this tutorial you will be able to explain the standard's logic, set inventory boundaries, sort emissions into its six categories, plan a credible inventory and prepare it for verification.
Course overview
Edition and status: The current edition is ISO 14064-1:2018, Greenhouse gases — Part 1: Specification with guidance at the organization level for quantification and reporting of greenhouse gas emissions and removals, the second edition, published by ISO in December 2018 and prepared by technical committee ISO/TC 207, subcommittee SC 7 (Greenhouse gas and climate change management and related activities). It replaced the 2006 first edition. ISO's catalogue states that the 2018 edition was reviewed and confirmed in 2024 and therefore remains current, but the same record now shows the standard at the stage "to be revised", with a working draft of a new edition (ISO/WD 14064-1) under development; the subcommittee also lists a draft amendment (DAmd 1) intended to define avoided emissions. In September 2025 ISO and the Greenhouse Gas Protocol announced a partnership, and on 29 July 2026 they published a plan to combine ISO 14064-1 with the GHG Protocol's Corporate Standard, Scope 2 Guidance, Scope 3 Standard and its Actions and Market Instruments workstream into a single harmonised corporate standard with a two-part structure, with a public consultation planned for the second quarter of 2027 and publication targeted for the fourth quarter of 2028. Until a new document is actually published, the 2018 edition is the one to apply, and this tutorial teaches it. Verified 2026-10-29 against the ISO catalogue record for ISO 14064-1:2018, the ISO/TC 207/SC 7 project list and the GHG Protocol announcement of 29 July 2026.
Who this is for: sustainability and ESG analysts, environmental and energy managers, finance and controlling staff who now own carbon numbers, procurement and supply-chain people asked for supplier emissions data, quality and compliance professionals, consultants, and engineers who are asked to provide fuel, refrigerant or production data for "the carbon report". It is also useful for anyone preparing for an independent GHG verification.
Prerequisites: none. Basic arithmetic (multiplying and adding quantities and converting units) is enough. Every climate and accounting term is explained the first time it appears, and no background in climate science is needed.
By the end of this tutorial:
- You will be able to explain what ISO 14064-1 is for, who uses it and how it fits into the ISO 14060 family of greenhouse gas standards.
- You will be able to define the core vocabulary, including GHG source and sink, activity data, emission factor, global warming potential and CO₂ equivalent.
- You will be able to describe the structure of the standard, from the five accounting principles to boundaries, quantification, quality management and reporting.
- You will be able to set organisational and reporting boundaries and sort emissions into the six categories of the 2018 edition.
- You will be able to plan and run an inventory cycle, including significance assessment, base-year choice and recalculation, and uncertainty assessment.
- You will be able to explain how independent verification works under ISO 14064-3, including levels of assurance and materiality, and why it is not the same as certification.
- You will be able to compare ISO 14064-1 with the GHG Protocol Corporate Standard and related standards for projects, products and carbon neutrality.
Lesson 1 – Origins, purpose and scope
Why organisations need a carbon accounting standard
Greenhouse gases are gases in the atmosphere that absorb and re-emit heat, warming the planet. Human activity adds them mainly by burning fossil fuels, but also through industrial processes, agriculture, waste, refrigerant leaks and land-use change. Almost every organisation is now asked how much it contributes. A bank wants the figure for its climate risk assessment, a large customer wants it from every supplier, a regulator may require it, and the board wants to set a reduction target. The difficulty is that a carbon figure is not read from a meter. It is built from many pieces of data, assumptions and conversion factors, and two people working on the same company can easily arrive at very different totals.
Without shared rules, nobody can tell whether a reported number includes the company's subsidiaries, whether it covers the electricity it buys or only the fuel it burns, whether last year's figure is comparable with this year's, or whether a reduction is real or only the result of a changed method. ISO 14064-1 exists to remove that ambiguity. It sets out principles and requirements for designing, developing, managing and reporting an organisation-level GHG inventory, which is a structured list of an organisation's GHG sources, sinks, emissions and removals over a defined period. It also explains what the organisation must do to support verification.
A short history
The first edition of ISO 14064 was published in 2006 in three parts: Part 1 for organisations, Part 2 for projects, and Part 3 for validation and verification. It drew heavily on the GHG Protocol Corporate Standard developed by the World Resources Institute (WRI) and the World Business Council for Sustainable Development (WBCSD), and used a similar split into direct emissions, energy-related indirect emissions and other indirect emissions. Over the following decade, supply-chain emissions became far more important in climate reporting, and the old split proved too coarse to show where indirect emissions actually come from.
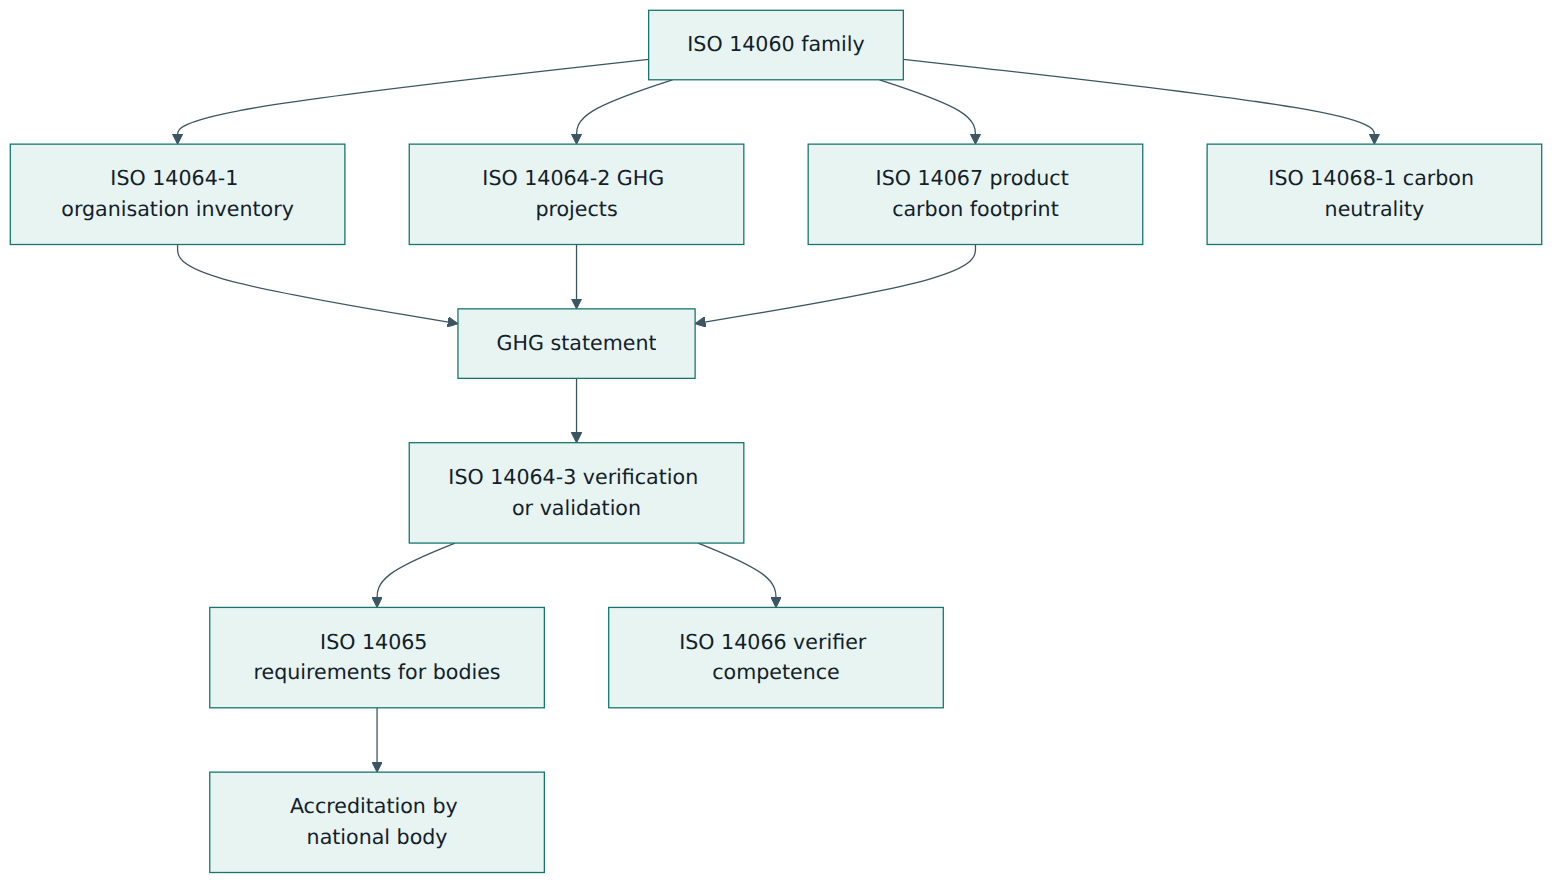
The 2018 edition kept the core logic but reorganised the indirect emissions into more detailed categories, added a formal process for deciding which indirect emissions are significant enough to include, strengthened the treatment of removals, biogenic carbon and electricity, and aligned the vocabulary with the revised Parts 2 and 3, which followed in 2019. Together with standards for verification bodies, verifier competence, product carbon footprints and carbon neutrality, these documents now form what ISO calls the ISO 14060 family.
What the standard does and does not do
It is important to be clear about the boundaries of the standard itself. ISO 14064-1 is a specification: it states requirements (expressed with "shall") and gives guidance (expressed with "should" and in the annexes). It tells you how to account, not how much you are allowed to emit. It sets no reduction targets, no emission limits and no carbon prices. It does not require an organisation to become carbon neutral, and it does not tell you which reduction technologies to use. The standard describes itself as GHG programme neutral: if a particular scheme, such as an emissions trading system, a national reporting law or a voluntary disclosure platform, applies to the organisation, that scheme's requirements apply in addition to those of ISO 14064-1.
The standard can be used by any type and size of organisation: a multinational group, a small manufacturer, a city council, a hospital, a university or a software company. The level of effort scales with the complexity of the organisation and with the intended use of the inventory. An inventory used only for internal energy management can be simpler than one that supports a public net-zero claim or a regulatory submission.
Who uses it and why
Organisations apply ISO 14064-1 because a customer, lender or programme names it as an acceptable basis, because it carries the authority of an international standard, or because they want independent verification under ISO 14064-3. Many report in a way that satisfies both ISO 14064-1 and the GHG Protocol at once, since the two are broadly compatible, which is also why their owners have decided to merge them.
Lesson 2 – Key concepts and vocabulary
Carbon accounting has its own language, and the standard uses it precisely. The following terms are explained in plain words; the standard's formal definitions are worded differently and should be read in the document itself.
- Greenhouse gas (GHG) – a gas, natural or human-made, that absorbs and emits infrared radiation and so contributes to warming. The inventory normally covers carbon dioxide (CO₂), methane (CH₄), nitrous oxide (N₂O), hydrofluorocarbons (HFCs), perfluorocarbons (PFCs), sulphur hexafluoride (SF₆) and nitrogen trifluoride (NF₃), plus other relevant gases.
- GHG source – a process or unit that releases a greenhouse gas into the atmosphere, such as a boiler, a delivery van, a leaking chiller or a landfill.
- GHG sink – a process that removes a greenhouse gas from the atmosphere, such as a growing forest that takes up CO₂.
- GHG reservoir – a component, other than the atmosphere, that can store a greenhouse gas, such as soil, wood, an underground geological formation or a storage tank.
- GHG emission – the release of a greenhouse gas into the atmosphere, measured as a mass over a period.
- GHG removal – the withdrawal of a greenhouse gas from the atmosphere by a sink, also measured as a mass over a period.
- Direct GHG emission – an emission from a source that the organisation owns or controls, for example fuel burned in its own furnaces or vehicles.
- Indirect GHG emission – an emission that results from the organisation's activities but occurs at sources owned or controlled by someone else, such as the power station that produces the electricity it buys, or the factory that makes its raw materials.
- Activity data – a quantitative measure of an activity that causes emissions or removals, such as litres of diesel, kilowatt-hours of electricity, tonnes of steel bought or kilometres flown.
- Emission factor – a coefficient that converts activity data into an emission, for example kilograms of CO₂ per litre of diesel. A removal factor does the same for removals.
- Global warming potential (GWP) – a factor that expresses how much heat a unit mass of a gas traps over a set time horizon, usually 100 years, compared with the same mass of CO₂. The values are published by the Intergovernmental Panel on Climate Change (IPCC) in its assessment reports.
- Carbon dioxide equivalent (CO₂e) – the common unit of an inventory: the mass of a gas multiplied by its GWP. It allows methane, refrigerants and CO₂ to be added together.
- Biogenic CO₂ – CO₂ released from, or taken up by, biological material such as wood, crops or biogas, as opposed to fossil carbon. It is reported separately because its climate effect depends on the carbon cycle of the biomass.
- Organisational boundary – the decision about which parts of the organisation (subsidiaries, joint ventures, facilities) are included, and in what share.
- Reporting boundary – the decision about which direct and indirect emissions and removals are included for the operations inside the organisational boundary.
- Base year – a historical period chosen as the reference against which later emissions are compared, often the starting point of a reduction target.
- GHG report – the document that presents the inventory and the information needed to understand it. A GHG statement is the factual declaration within it that is the subject of verification.
- Materiality and level of assurance – verification terms. Materiality is the size of error or omission that would change the decisions of intended users; the level of assurance (reasonable or limited) describes how much confidence the verifier's conclusion gives.
The five principles
Before any requirement, ISO 14064-1 sets out five principles that guide every judgement in the inventory. They are the same five ideas found in the GHG Protocol, which helps the two approaches stay compatible. When a rule does not answer your question, the principles do.
- Relevance – choose sources, sinks, data and methods that suit the needs of the people who will use the inventory.
- Completeness – include all relevant emissions and removals inside the chosen boundaries, and explain any exclusions.
- Consistency – use methods that allow meaningful comparison over time, and document any change in data, boundary or method.
- Accuracy – reduce bias and uncertainty as far as is practical, so that figures are neither systematically too high nor too low.
- Transparency – disclose enough information, assumptions and references for users to understand and trust the figures.
The principles sometimes pull in different directions. Completeness might push you to include a supply-chain category where data is poor, while accuracy warns that the estimate will be rough. The usual answer is to include a reasonable estimate, state its uncertainty and plan to improve it, because a known gap with a rough number is more useful than a silent omission.
A quick worked conversion
Suppose a site uses 10,000 litres of diesel in a year and the emission factor is about 2.7 kg CO₂e per litre. The emissions are 10,000 × 2.7 = 27,000 kg, or 27 tonnes CO₂e. Now suppose a chiller lost 5 kg of a refrigerant whose GWP is roughly 2,000. The leak counts as 5 × 2,000 = 10,000 kg, or 10 tonnes CO₂e. A few kilograms of leaked gas can matter as much as thousands of litres of fuel, which is why the inventory has to look beyond energy. (The factors here are rounded examples; real inventories use published, referenced factors.)
Lesson 3 – Structure of the standard
ISO 14064-1:2018 is organised into ten clauses followed by informative annexes. Clauses 1 to 3 are introductory, and clauses 4 to 10 contain the content an inventory has to satisfy. The summary below is a paraphrase of the structure, not the text of the standard.
| Clause | Title (short form) | What it covers, in plain words |
|---|---|---|
| 1–3 | Scope, normative references, terms and definitions | What the document applies to and the vocabulary it uses. |
| 4 | Principles | Relevance, completeness, consistency, accuracy and transparency. |
| 5 | GHG inventory boundaries | Organisational boundaries (control or equity share) and reporting boundaries, including the categories of direct and indirect emissions and how significant indirect emissions are selected. |
| 6 | Quantification of GHG emissions and removals | Identifying sources and sinks, choosing a quantification approach, selecting data and factors, calculating, and setting and recalculating the base-year inventory. |
| 7 | Mitigation activities | How reduction initiatives, removal enhancements and projects are treated and reported, and how targets relate to the inventory. |
| 8 | GHG inventory quality management | Information management procedures, document retention and record keeping, and assessment of uncertainty. |
| 9 | Reporting of GHGs | Planning the GHG report and the information it must, and should, contain. |
| 10 | Organisation's role in verification activities | What the organisation does when its inventory is verified: preparing, giving access, and the relationship to ISO 14064-3. |
The annexes are informative, meaning they guide rather than add requirements. They cover topics such as consolidating data from different facilities, examples of how emissions fall into the categories, selecting and using quantification data, the treatment of biogenic carbon, the treatment of purchased electricity, a suggested structure for the GHG report and, among others, guidance on the process for identifying significant indirect emissions.
Clause 5: boundaries in two steps
Boundaries are set in two steps, and getting them right is the foundation of everything else.
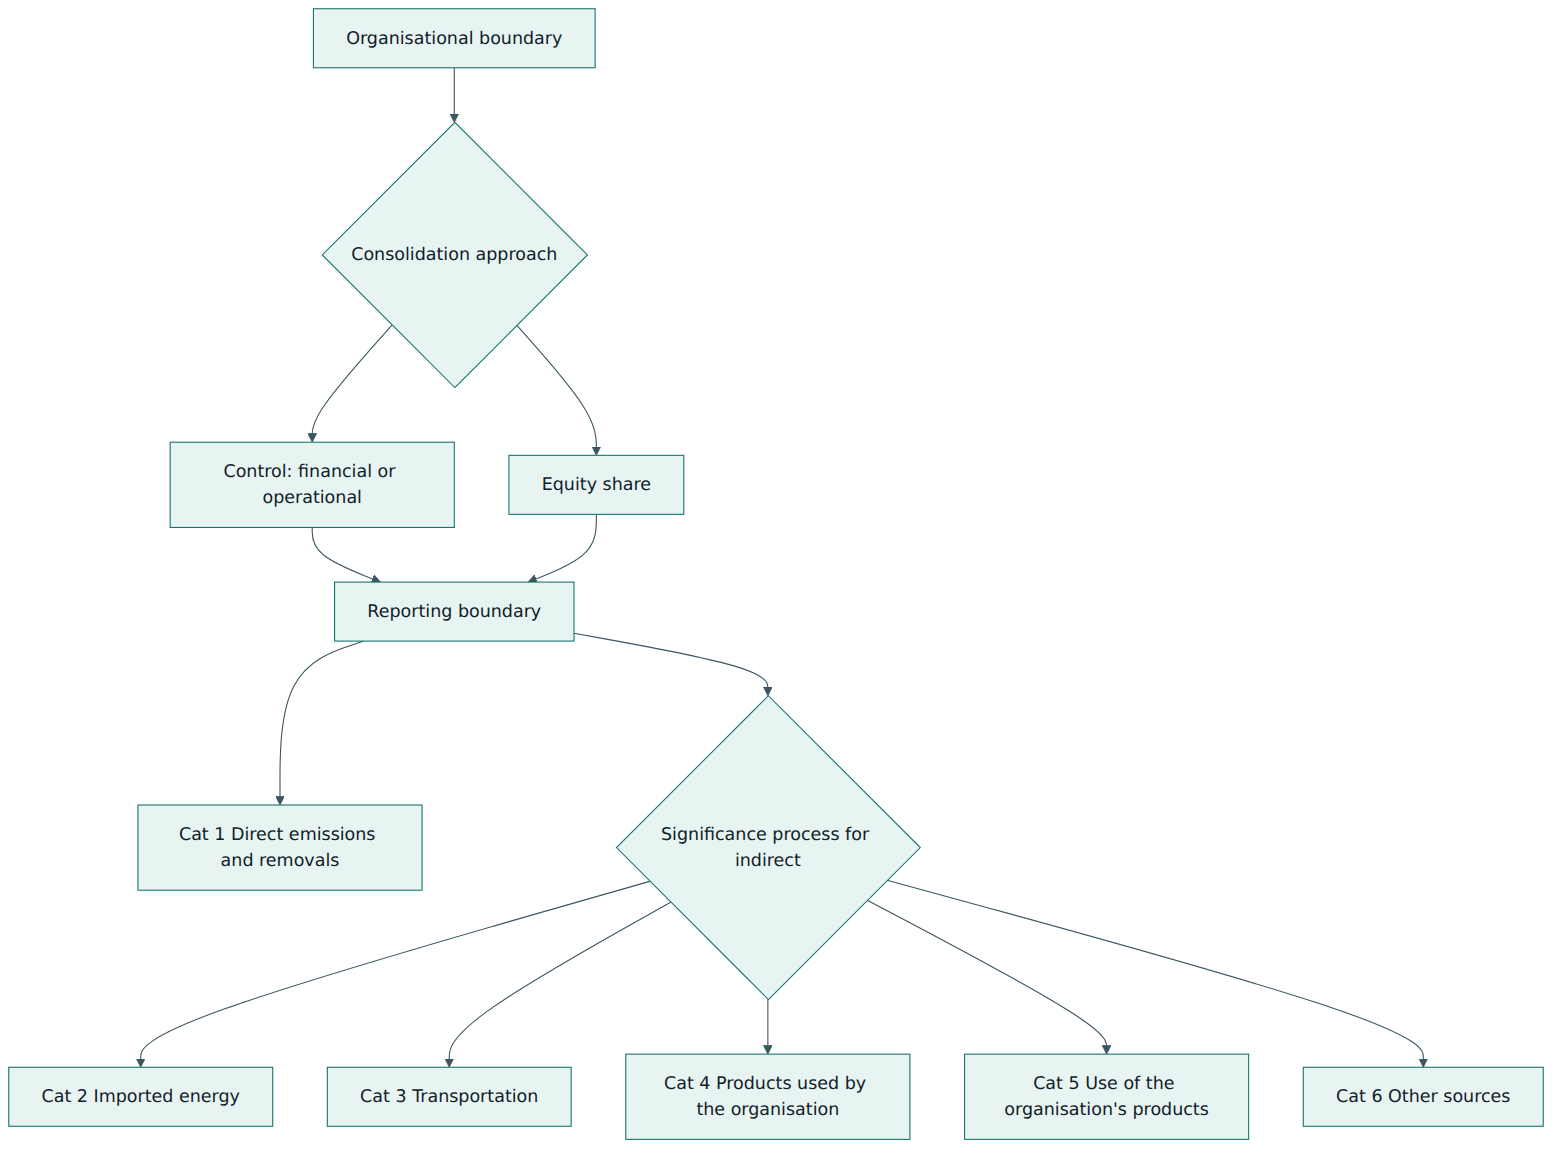
The organisational boundary answers "which parts of the organisation count, and how much of each?". The standard allows two consolidation approaches. Under a control approach, the organisation includes 100 % of the emissions of facilities it controls and none from those it does not. Control can be judged financially (the ability to direct financial and operating policies to gain economic benefits) or operationally (the authority to introduce and implement operating policies). Under the equity share approach, the organisation includes its share of each facility's emissions according to its ownership interest. Each approach is legitimate; what matters is that the choice is made deliberately, documented, applied consistently and explained if it changes.
The reporting boundary answers "which emissions and removals are included for those operations?". Direct emissions and removals from controlled sources are always included. Indirect emissions are included according to a documented significance process, described below.
The six categories of the 2018 edition
The 2018 edition sorts emissions and removals into six categories. Category 1 holds the direct ones; categories 2 to 6 hold the indirect ones, grouped by where they arise.
| Category | What it contains | Typical examples |
|---|---|---|
| 1 – Direct | Emissions and removals from sources and sinks inside the organisational boundary | Boilers, furnaces, company vehicles, process chemistry, refrigerant leaks, on-site forestry removals |
| 2 – Imported energy | Indirect emissions from generating energy the organisation imports | Purchased electricity, steam, heat and cooling |
| 3 – Transportation | Indirect emissions from transport services used by or for the organisation | Inbound and outbound freight by carriers, business travel, employee commuting |
| 4 – Products used by the organisation | Indirect emissions from goods and services it buys | Raw materials, packaging, capital equipment, cloud and other services, waste treatment |
| 5 – Use of the organisation's products | Indirect emissions linked to products after they leave the organisation | Energy used by sold products, end-of-life treatment, leased-out assets |
| 6 – Other sources | Indirect emissions that do not fit the other categories | Specific emissions that the organisation identifies and justifies |
Readers who know the GHG Protocol will see the mapping: category 1 corresponds to Scope 1, category 2 broadly to Scope 2, and categories 3 to 6 together to Scope 3. The categories are more descriptive than "Scope 3", which can hide very different kinds of emissions under a single label. The exact mapping of some items, such as transport of purchased goods, needs care, so an organisation reporting under both systems should document how it maps each item.
Significance of indirect emissions
An organisation cannot quantify every indirect emission in the world economy that is linked to it, so the 2018 edition asks it to define and apply criteria for deciding which indirect emissions are significant. Typical criteria include the expected magnitude of the emissions, the organisation's ability to influence them, the availability and quality of data, the level of risk or opportunity they represent, sector expectations, and the interests of the people who will use the report. The organisation must document the process, apply it consistently, and justify the exclusion of any indirect emissions it decides not to quantify. The intended users of the inventory, for example a customer or an investor, can reasonably challenge a process that conveniently excludes the largest sources.
Clause 6: quantification
Quantification starts by identifying each source and sink inside the boundaries. For each one, the organisation chooses a quantification approach: calculation (activity data multiplied by an emission or removal factor), measurement (for example continuous emissions monitoring on a stack), or a combination. It must select and collect the data, choose factors that are appropriate and from recognised sources, explain the choice, and apply GWP values to convert each gas into CO₂e. The values usually come from the latest IPCC assessment report; where a programme specifies other values, or older values are used for consistency, that choice should be stated.
The standard asks for emissions to be reported in tonnes of CO₂e, and for direct emissions to be broken down by gas. It also asks for some items to be reported separately rather than mixed into the total: CO₂ from the combustion or decay of biomass, removals, and any emission reductions or removals achieved through projects or purchased instruments. Keeping these separate prevents a large removal or a purchased carbon credit from quietly hiding an increase in actual emissions.
Clause 6 also covers the base year. The organisation selects a historical base year for which verifiable data exists, or uses a multi-year average, explains the choice, and quantifies the base-year inventory using the same rules. It then defines a recalculation policy: when structural changes (acquisitions, divestments, outsourcing), changes in methods or factors, or discovered errors cause a significant change, the base year is recalculated so that comparisons remain like for like. Without that policy, buying a company could look like a rise in emissions and selling a plant could look like a reduction.
Clauses 7 to 10
Clause 7 deals with mitigation. An organisation may plan and implement initiatives that reduce emissions or increase removals, such as switching fuels, installing heat pumps, or planting trees on its land. Their effect shows up in the inventory itself over time. Reductions or removals from separate GHG projects, including credits bought from projects run by others, are reported separately and not subtracted from the inventory totals. If the organisation sets reduction targets, it should describe them and their relationship to the base year.
Clause 8 is about quality management: written procedures for collecting and handling information, defined responsibilities, checks for errors, retention of records and evidence, regular review of the inventory, and an assessment of uncertainty. Clause 9 covers the GHG report: who it is for, what it must include, and what it should include. Clause 10 describes the organisation's role when the inventory is verified. These clauses are described in more practical terms in the next two lessons.
Lesson 4 – How it works in practice
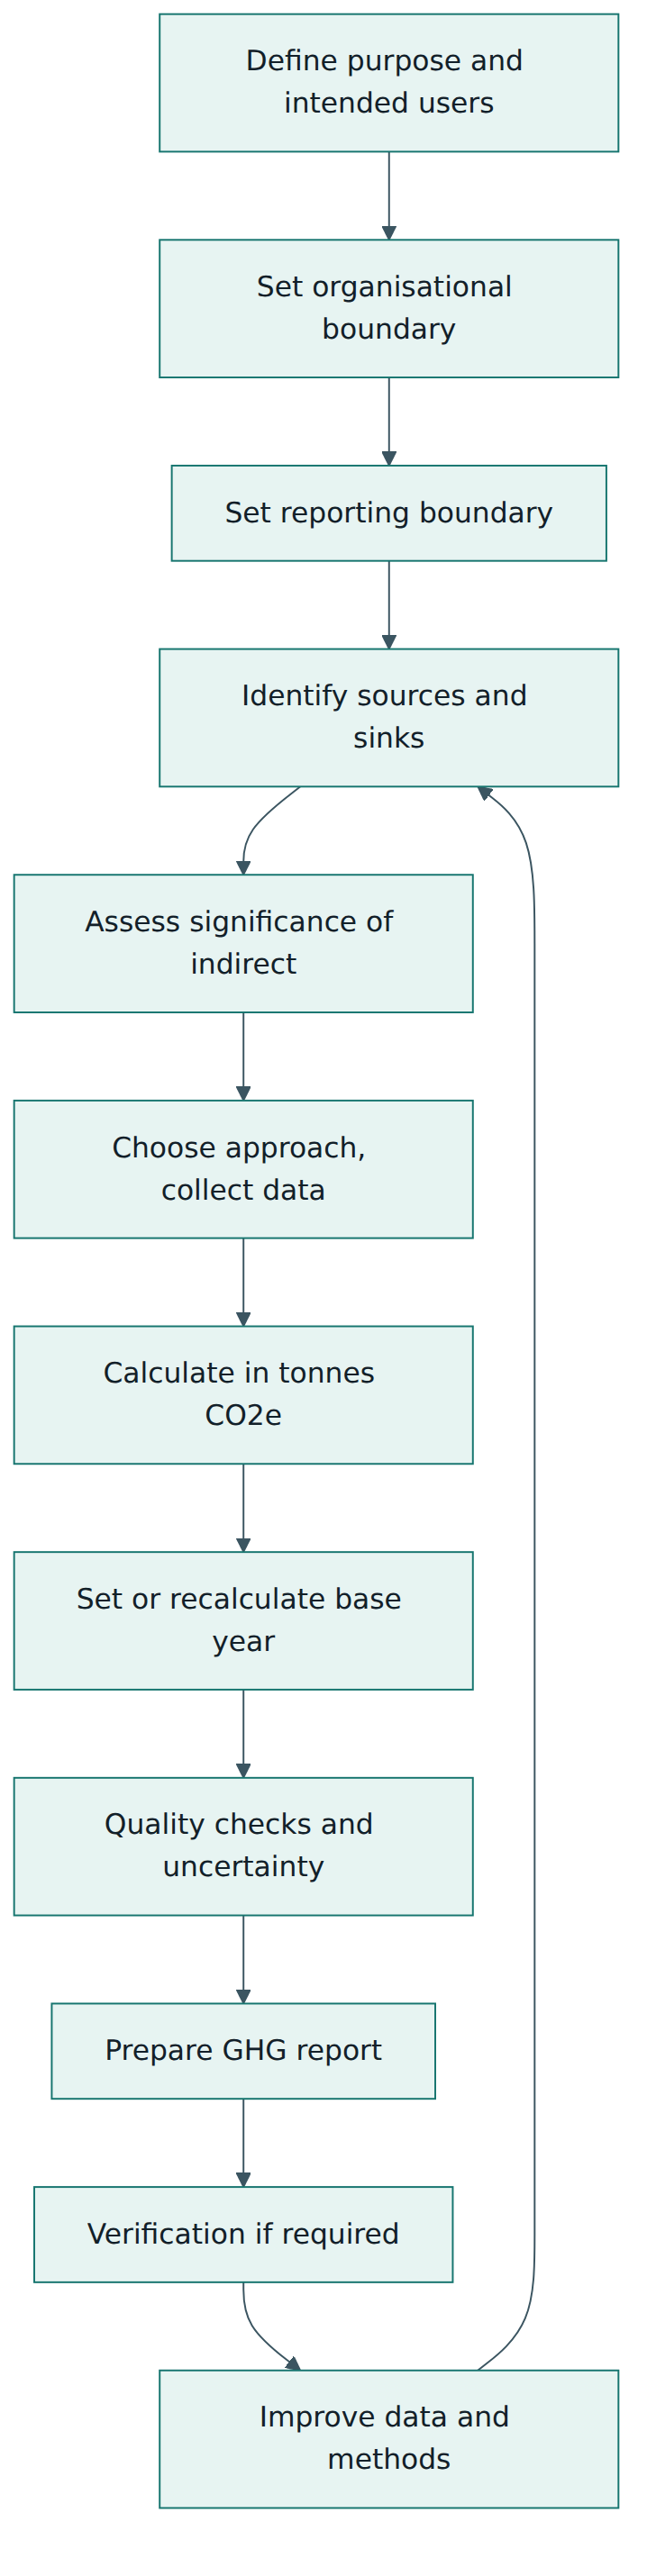
An inventory is not a one-off spreadsheet. It is a cycle that repeats every reporting period, usually each financial or calendar year, and improves each time. The diagram shows the main steps.
Step 1: define purpose and intended users
Start by asking who will use the inventory and for what. A company preparing for a mandatory climate disclosure, a customer questionnaire, a science-based target or an internal energy programme will make different choices about boundaries, detail and verification. The standard calls these people intended users, and the principle of relevance ties decisions to their needs. Write the purpose down, because it will guide the significance criteria and the level of verification later.
Step 2: set boundaries and map sources
List every legal entity, facility and significant asset, decide on the consolidation approach, and record the reason. Then walk through each facility and list sources and sinks: stationary combustion (boilers, generators, ovens), mobile combustion (vehicles, forklifts), process emissions (chemical reactions in cement, glass, chemicals or electronics production), fugitive emissions (refrigerant and SF₆ leaks, methane from wastewater), and any land-based removals. Site visits find things a desk review misses, such as a diesel generator used during power cuts or fire-suppression gases.
For indirect emissions, build a long list across categories 2 to 6, estimate the rough size of each using quick screening methods such as spend-based factors, and apply the significance criteria. Spend-based screening multiplies money spent in a purchasing category by an average emission factor per unit of currency. It is rough, but it is usually good enough to show which categories are large.
Step 3: collect data and quantify
Assign an owner for each data stream: facilities for fuel and electricity, maintenance for refrigerant top-ups, logistics for freight, travel for flights, procurement for purchased materials, sales for product volumes. Agree the units, evidence and deadlines in advance. Prefer primary data, such as meter readings, fuel invoices and supplier-specific emission figures, over secondary averages, and record the source of every emission factor with its version and year.
For purchased electricity, two methods are in common use. A location-based method uses the average emission factor of the grid where the electricity is consumed. A market-based method uses factors from the organisation's contractual instruments, such as renewable energy certificates or a power purchase agreement, where those meet quality criteria. The 2018 edition gives guidance on both. Many organisations report both figures, because each answers a different question: the first reflects the grid the site physically draws on, the second reflects the organisation's purchasing choices. State clearly which figure is used for targets.
Step 4: base year and recalculation policy
Pick the earliest year with reliable data for the main sources, or the year of a target commitment, and document a threshold for recalculation, for example any structural change or method correction that changes base-year emissions by more than a stated percentage. Apply the policy mechanically, so that the decision to recalculate is not influenced by whether the new figure looks better or worse.
Step 5: quality management and uncertainty
Quality management means routine checks that catch errors before anyone else does: reasonableness checks against last year, unit checks, duplicate checks, reconciliation of fuel data with invoices, review by a second person, and version control for the calculation files. Uncertainty assessment estimates how far the reported figure may be from the true value. Measured fuel use is usually precise; estimates of purchased goods based on spend are not. The standard expects the organisation to assess uncertainty and to use the result to prioritise improvements, not to hide it. A simple approach rates each data stream as high, medium or low quality and records the reason; more advanced inventories combine percentage uncertainties statistically.
Step 6: report, verify and improve
Write the GHG report (Lesson 5 covers its content), arrange verification if users require it, and keep a list of improvement actions that start the next cycle.
Roles and artefacts
A typical inventory team has an executive sponsor who approves boundaries and the final report, an inventory lead who owns methods and the timetable, data owners in each function, a reviewer independent of the calculations, and, where needed, an external adviser. Useful artefacts include a boundary and methodology document, a source and sink register, a significance assessment, a data collection plan, a calculation workbook or software system, an emission factor library, an uncertainty assessment, a base-year file, the GHG report and an evidence folder for the verifier.
Lesson 5 – Assessment, certification and compliance
Verification, not certification
People often talk about "ISO 14064 certification", but the correct term for an organisation's inventory is verification. ISO 14064-1 is not a management-system standard like ISO 14001 or ISO 9001, and there is no certificate saying "this company conforms". Instead, an independent body examines a specific GHG statement for a specific period, for example "Scope 1 and 2 emissions for 2025 were 12,400 tonnes CO₂e", and issues a verification opinion or statement about it. Next year's figure needs a new verification. Some programmes and bodies use the word "certificate" loosely for this output, so read what is actually covered.
Verification is carried out under ISO 14064-3:2019, the specification for validating and verifying GHG statements, by a validation or verification body. Bodies that meet ISO 14065:2020 (requirements for bodies that validate and verify environmental information) can be accredited by a national accreditation body, and ISO 14066 sets the competence expected of verification teams. Accreditation is optional in many voluntary contexts but often required by regulated programmes or by customers.
Levels of assurance and materiality
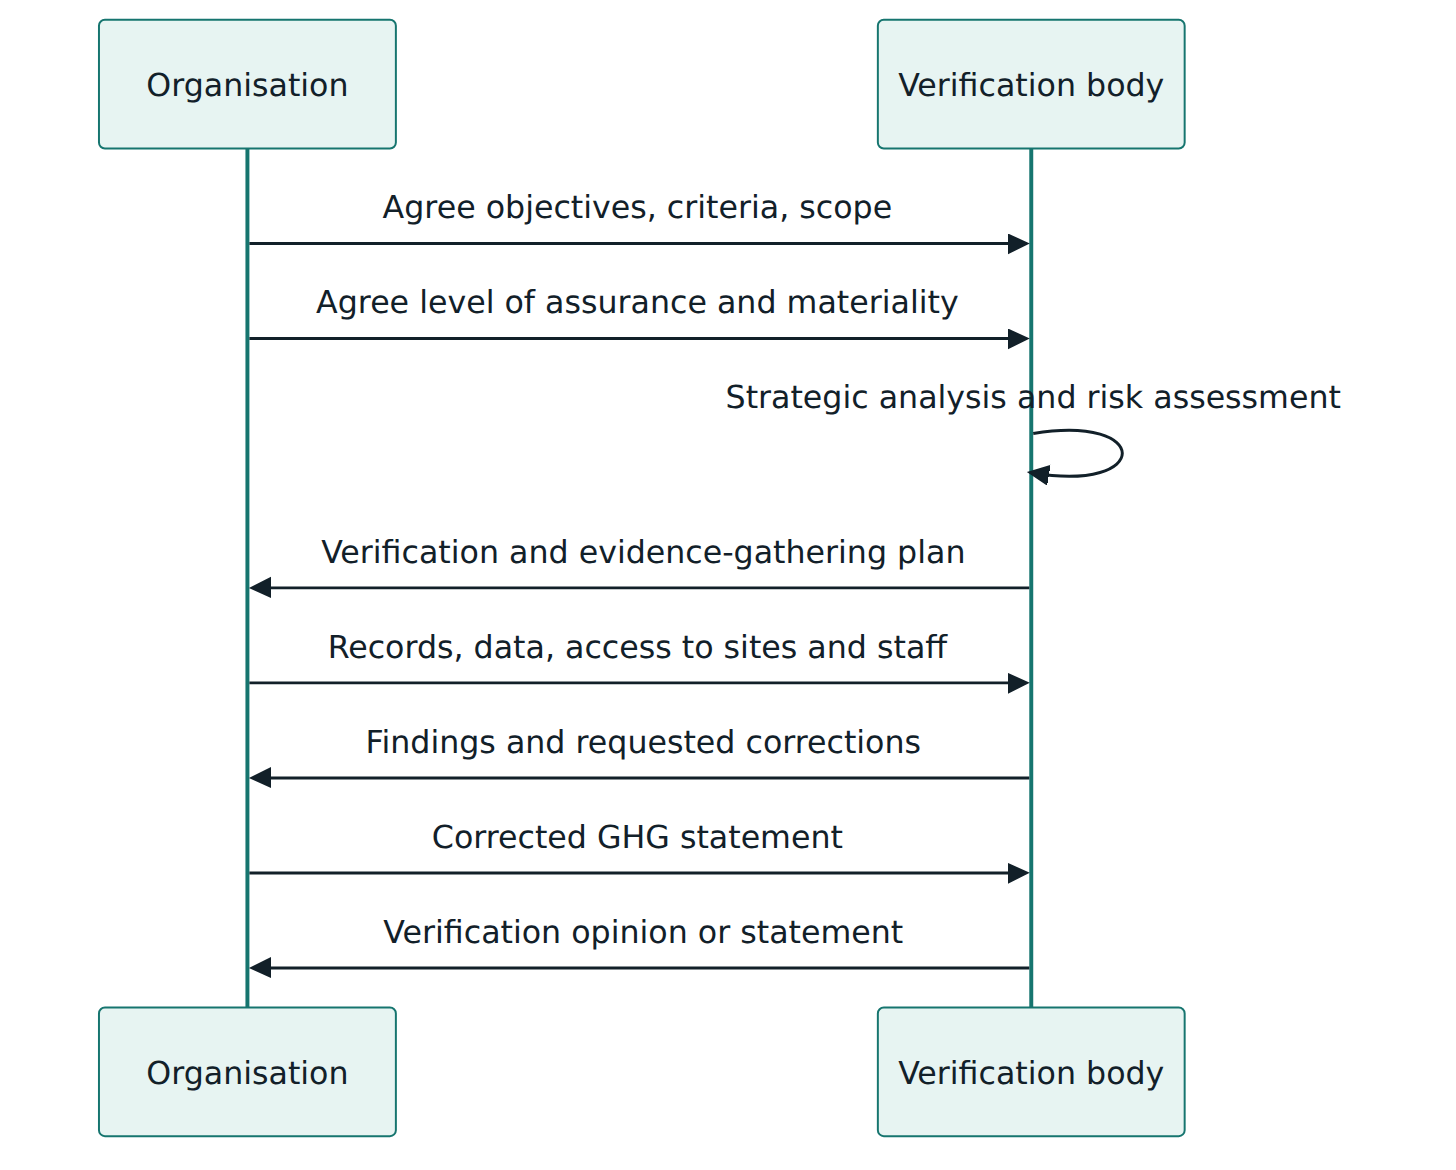
Before the work starts, the organisation and the verifier agree the level of assurance, the objectives, the criteria (here, ISO 14064-1 plus any programme rules), the scope and the materiality. There are two levels of assurance in common use:
- Reasonable assurance – a high but not absolute level. The verifier gathers enough evidence to give a positive opinion that the statement is fairly stated, for example "in our opinion the statement is materially correct". It involves more testing, recalculation and site evidence.
- Limited assurance – a lower level, with less extensive procedures. The conclusion is phrased negatively, stating that the verifier found no evidence suggesting the statement is materially wrong, rather than affirming that it is correct.
Materiality is the threshold above which errors, omissions or misrepresentations, individually or together, would affect the decisions of intended users. Verifiers often use a quantitative threshold (for example a percentage of total emissions) alongside qualitative judgement: a small error that is intentional, or that affects a target claim, may still be material.
What happens during verification
The verifier first studies the organisation, its sources and its data systems, and identifies where material misstatements are most likely. A cement plant's process emissions, a retailer's refrigerant leaks or a software company's purchased cloud services might be the riskiest items. The verifier then tests controls and data: tracing fuel totals to invoices, checking meter calibrations, recalculating samples, comparing factors with their sources, reviewing the significance assessment and confirming that exclusions are justified. Findings are raised, the organisation corrects errors where needed, and the verifier forms an opinion. Clause 10 of ISO 14064-1 reminds the organisation of its part: define the objectives with the verifier, provide the GHG report and supporting information, give access to people and sites, and respond to findings.
What the GHG report contains
The required content of the report includes, in summary: a description of the organisation and the person responsible, the reporting period, the organisational boundary and consolidation approach, the reporting boundary with the significance criteria and any exclusions, direct emissions broken down by gas, separate figures for biogenic CO₂ and removals, indirect emissions by category, the base year and any recalculation, the quantification methods and factors used and changes to them, the uncertainty assessment, the GWP values used, a statement that the report has been prepared in accordance with ISO 14064-1, and a statement of whether the inventory has been verified and, if so, the type of verification and level of assurance. Further information, such as reduction targets, mitigation initiatives and intensity ratios (emissions per unit of output or revenue), is recommended. The precise lists in clause 9 should be checked against the standard itself.
Compliance and claims
ISO 14064-1 is voluntary unless a contract, programme or law makes it mandatory. Several national and regional reporting schemes either use it or accept inventories prepared with it, and disclosure regimes increasingly require assurance of reported emissions. Because a claim such as "our 2025 inventory conforms to ISO 14064-1" is public and checkable, it should be supported by a report that contains all required information, and ideally by a verification statement from a competent independent body. Claims of carbon neutrality or net zero are separate: they depend on additional standards, such as ISO 14068-1, and on the credibility of any offsets used.
Lesson 6 – Worked example: Northfield Packaging
Northfield Packaging is a fictional manufacturer of cardboard boxes and plastic trays with 600 employees. It owns two plants, a small head office and a truck fleet, and it holds a 40 % stake in a recycling joint venture run by a partner company. A major retail customer has asked all suppliers for an ISO 14064-1 inventory with limited assurance, and the board wants to set a reduction target. All figures below are illustrative and rounded.
Step 1: purpose and boundaries
The intended users are the retail customer, the board and Northfield's bank. The sustainability lead proposes the operational control approach, because Northfield runs its own plants, fleet and office but does not run the joint venture. Under that approach the joint venture's emissions are not included in category 1, although Northfield records the decision and notes that, under an equity share approach, 40 % of the venture's emissions would be included. The board approves the choice and the reason is written into the methodology document.
Step 2: sources and significance
A site walk at both plants lists natural gas boilers, a gas-fired dryer, diesel trucks and forklifts, a backup generator, chillers using an HFC refrigerant and a small on-site wastewater lagoon. Electricity and some purchased steam come from outside suppliers. For indirect emissions, the team screens categories 3 to 6 using spend data. The screening shows that purchased paperboard and plastic resin (category 4) are by far the largest, followed by outsourced freight and business travel (category 3), and end-of-life of sold trays (category 5). Employee commuting is small but the customer asked for it, so it is included. The team agrees criteria based on magnitude, influence, data availability and customer interest, and documents why minor items such as office supplies are excluded.
Step 3: quantification
Data owners provide gas invoices, fuel card data, refrigerant top-up logs from the maintenance contractor, electricity bills and purchasing data. The team calculates:
| Category | Main sources | Method | Result (t CO₂e) |
|---|---|---|---|
| 1 – Direct | Gas boilers and dryer, truck and forklift diesel, refrigerant leaks, generator | Invoices and logs × published factors and GWPs | 9,200 |
| 2 – Imported energy | Electricity and steam | Location-based grid factor (market-based also shown) | 6,100 |
| 3 – Transportation | Outsourced freight, flights, commuting | Tonne-kilometres and distance-based factors, survey | 3,800 |
| 4 – Products used | Paperboard, resin, inks, waste treatment | Supplier-specific data for two suppliers, averages for the rest | 41,500 |
| 5 – Use of products | End-of-life of sold trays and boxes | Mass sold × treatment-route factors | 7,400 |
| 6 – Other | None identified as significant | Documented as such | 0 |
The total is 68,000 tonnes CO₂e, of which only 9,200 tonnes are direct. The refrigerant leaks, at about 700 tonnes, surprise the team: a single chiller with a faulty valve accounts for most of them. Biogenic CO₂ from a small biomass boiler at one plant is quantified and shown separately from the fossil emissions, as the standard expects, so readers can see both figures. Northfield buys renewable electricity certificates for the head office, so the market-based category 2 figure is slightly lower than the location-based figure; both are shown.
Step 4: base year, quality and uncertainty
The team chooses 2025 as the base year, because it is the first year with complete data for categories 1 and 2 and for the main purchased materials, and sets a recalculation threshold of 5 % of base-year emissions. A second analyst checks every unit conversion and reconciles fuel volumes with invoices, finding that one month of gas use was counted twice. The uncertainty assessment rates category 1 and 2 data as high quality, freight as medium, and purchased materials as low quality except for the two suppliers that provided product-specific footprints. The improvement plan prioritises supplier data from the next five largest suppliers.
Step 5: report and verification
The GHG report describes the company, the boundaries and the reason for operational control, the significance criteria and exclusions, results by category and by gas, biogenic CO₂, methods and factors, the base year and the recalculation policy, uncertainty, and a statement of preparation in accordance with ISO 14064-1. Northfield engages an accredited verification body for limited assurance on categories 1 and 2 and on the purchased-materials figure, with a materiality threshold of 5 %. The verifier samples gas invoices and refrigerant logs, visits one plant, and finds that the generator diesel was missing. The figure is corrected (an extra 40 tonnes), and the verifier issues a limited assurance statement.
Step 6: what changes next year
In the following year Northfield buys a third plant. Because the acquisition changes base-year emissions by more than 5 %, the team recalculates the base year to include the new plant's historical emissions, so the target remains comparable. It repairs the faulty chiller and starts a leak-check programme, receives product data from more suppliers, and moves its board target from a total-emissions goal to a combination of absolute and intensity targets. The worked example shows the main lesson of the standard: the value of an inventory comes from clear boundaries, honest data quality and consistent methods over time, not from a single impressive number.
Lesson 7 – Relationship to other standards and frameworks
ISO 14064-1 is one of several documents used in carbon accounting. Understanding how they fit together prevents the common mistake of applying the wrong one to a question.
| Standard or framework | Owner | Level and purpose | Relationship to ISO 14064-1 |
|---|---|---|---|
| GHG Protocol Corporate Standard, Scope 2 Guidance and Scope 3 Standard | WRI and WBCSD | Organisation-level accounting and reporting using Scopes 1, 2 and 3 | Same principles and very similar logic; ISO uses six categories instead of three scopes. A merged joint standard is planned for late 2028. |
| ISO 14064-2:2019 | ISO | Project level: quantifying reductions or removal enhancements from a specific project against a baseline | Projects that generate credits are quantified here, and their results are kept separate from the organisation's inventory. |
| ISO 14064-3:2019 | ISO | Validation and verification of GHG statements for organisations, projects and products | The standard verifiers use to check an ISO 14064-1 inventory. |
| ISO 14065:2020 and ISO 14066 | ISO | Requirements for verification bodies and for the competence of their teams | Basis for accrediting bodies that verify ISO 14064-1 inventories. |
| ISO 14067:2018 | ISO | Carbon footprint of a single product across its life cycle | Product data from suppliers can improve category 4 figures; the methods differ in scope and allocation. |
| ISO 14068-1:2023 | ISO | Requirements for claims of carbon neutrality | Uses a quantified footprint, such as an ISO 14064-1 inventory, as its starting point and adds rules on reductions and offsetting. |
| ISO 14001 | ISO | Environmental management system requirements | A management system that can use the GHG inventory as an input for aspects, objectives and monitoring. |
ISO 14064-1 and the GHG Protocol
The GHG Protocol is the most widely used corporate carbon accounting framework, and many disclosure rules and voluntary programmes refer to it. Because ISO 14064-1 was built on the same foundations, an inventory can often meet both. The main differences are in presentation and in the degree of prescription: ISO uses six categories with a significance process, while the GHG Protocol uses three scopes with fifteen defined Scope 3 categories. The GHG Protocol's Scope 2 Guidance sets detailed rules for dual reporting of location-based and market-based electricity emissions. An organisation reporting under both should document how each item maps between the two systems. The planned joint standard is intended to end the need for this parallel work, but until it is published, both existing frameworks remain in use.
Disclosure frameworks
Corporate reporting frameworks such as the IFRS sustainability disclosure standards and the European Sustainability Reporting Standards set what climate information must be disclosed, and they generally refer to the GHG Protocol for measurement. An ISO 14064-1 inventory provides much of the underlying data, but an organisation subject to such a framework must check that its inventory meets that framework's own requirements on boundaries and methods.
Common pitfalls and best practices
Pitfalls
- Boundary drift – changing the consolidation approach, or quietly adding and removing sites, without documenting it, so that year-to-year comparisons become meaningless.
- Convenient exclusions – using the significance process to leave out the largest but hardest indirect categories, such as purchased materials, while reporting only energy.
- Netting off credits – subtracting purchased carbon credits or project reductions from the inventory total instead of reporting them separately.
- Forgotten sources – missing refrigerant leaks, backup generators, fire-suppression gases or process emissions because the inventory was built only from energy bills.
- Unreferenced factors – using emission factors without recording their source, year and version, so nobody can reproduce or update the calculation.
- No recalculation policy – leaving the base year unchanged after an acquisition or divestment, making emissions appear to rise or fall for reasons unrelated to performance.
- Calling it certification – telling customers the company is "ISO 14064 certified" when only one year's statement has been verified, or none at all.
Best practices
- Write the methodology first – document purpose, boundaries, significance criteria, factors and recalculation rules before collecting data, and update the document every cycle.
- Name data owners – give every data stream an owner, a deadline and an evidence requirement, so that information arrives on time and can be verified.
- Screen broadly, then refine – estimate every indirect category roughly, then spend effort improving the largest and most uncertain ones.
- Report both electricity figures – show location-based and market-based results and state which one supports the target.
- Keep removals and biogenic CO₂ separate – make it impossible for a removal or a credit to hide an increase in emissions.
- Use an independent internal review – have someone who did not build the calculation check units, totals and changes before the verifier arrives.
- Plan for verification early – agree the level of assurance and materiality with intended users and keep an evidence folder from the start of the year.
Summary and key takeaways
- ISO 14064-1:2018 sets principles and requirements for organisation-level GHG inventories; it is under revision and planned to merge with the GHG Protocol corporate standards, but the 2018 edition remains the one to apply.
- The five principles of relevance, completeness, consistency, accuracy and transparency guide every decision the requirements leave open.
- Boundaries come in two steps: an organisational boundary using a control or equity share approach, then a reporting boundary that covers direct emissions and significant indirect ones.
- The 2018 edition groups emissions into six categories, from direct emissions to imported energy, transport, purchased products, use of sold products and other sources.
- Emissions are quantified by calculation, measurement or both, converted to tonnes CO₂e with GWPs, and reported with biogenic CO₂, removals and credits kept separate.
- A documented base year and a recalculation policy keep comparisons fair after acquisitions, divestments or method changes.
- Quality management and uncertainty assessment make the inventory reliable and show where to improve.
- Inventories are verified under ISO 14064-3 at a reasonable or limited level of assurance; this is verification of a statement, not certification of the organisation.
Reflection questions
- Think of your own organisation. Which consolidation approach would you choose for its organisational boundary, and which subsidiaries or joint ventures would be in or out as a result?
- Which three indirect sources do you expect to be the largest for your organisation, and what criteria would you use to defend including or excluding others?
- Where would you get activity data for refrigerant leaks, freight and purchased materials, and how would you rate the quality of each data stream?
- Your organisation sells one of its factories halfway through the year. How would you treat that in the current inventory and in the base year, and how would you explain it to readers?
- A customer asks whether your inventory is "ISO 14064 certified". How would you answer accurately, and what level of assurance would you recommend for their purpose?
Further reading and official sources
- ISO 14064-1:2018 – Greenhouse gases – Part 1: Specification with guidance at the organization level – ISO
- ISO 14064-3:2019 – Specification with guidance for the verification and validation of GHG statements – ISO
- ISO/TC 207/SC 7 – Projects under revision – ISO technical committee
- GHG Protocol announces key standard development updates – Greenhouse Gas Protocol
- Corporate suite standards and guidance update process – Greenhouse Gas Protocol
- GHG Protocol Corporate Standard – WRI and WBCSD
Original tutorial by xOps School (DevOpsSchool Private Limited), written from public sources about ISO 14064-1. Not affiliated with or endorsed by the standard's owner; standard names are trademarks of their owners. Buy the official standard from its publisher for the authoritative text.