
Six Sigma – Tutorial (about 60 minutes)
- View
Six Sigma is a data-driven method for improving processes by finding and removing the causes of defects and by reducing the variation that makes results unpredictable. It is used in manufacturing, logistics, banking, insurance, healthcare, telecoms, software and IT operations, wherever a process repeats often enough to be measured. After this tutorial you will be able to explain what Six Sigma means as a metric, a method and a management approach, use its core vocabulary and measures correctly, walk a project through the five DMAIC phases, recognise the roles and certifications involved, and judge when Six Sigma is the right tool and when it is not.
Course overview
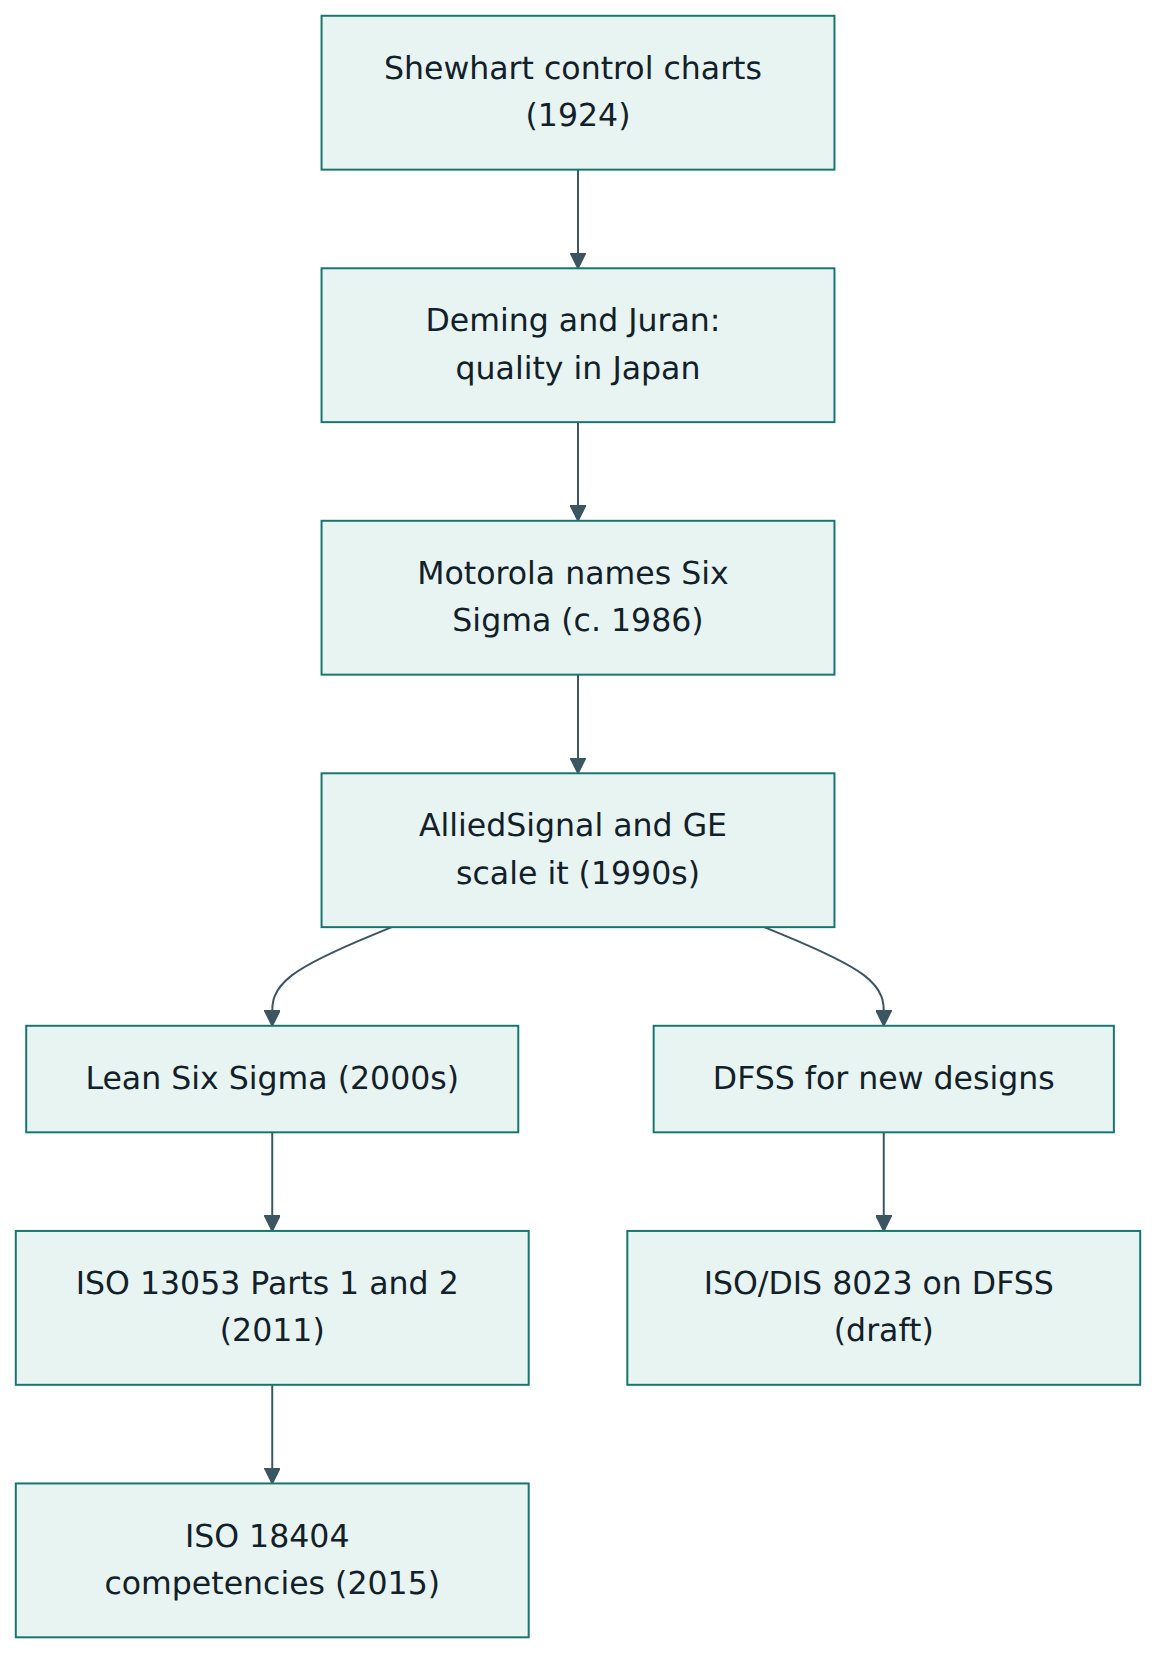
Edition and status: Six Sigma is a methodology, not a single published standard, and no one body owns it. It grew out of Motorola in the mid-1980s and was spread by companies such as AlliedSignal and General Electric in the 1990s. The international reference documents are maintained by ISO technical committee ISO/TC 69 (applications of statistical methods), subcommittee SC 7: ISO 13053-1:2011 (Part 1: DMAIC methodology) and ISO 13053-2:2011 (Part 2: Tools and techniques), both published in August 2011 and confirmed without change at their last systematic reviews in 2022; earlier revision projects for both parts were abandoned, so the 2011 editions remain current. ISO 18404:2015, on competencies for Six Sigma and Lean personnel and organisations, was published in November 2015 and confirmed in 2025. A new standard on Design for Six Sigma, ISO/DIS 8023, is still a draft (its enquiry vote closed in July 2026) and is not yet published. Belt certifications are offered by many independent bodies, such as ASQ and IASSC, each with its own body of knowledge. Verified 2026-10-29.
Who it is for: engineers, operations and service managers, quality and continuous-improvement staff, project and product people, analysts and anyone who has been asked to "run a Green Belt project" or to read one and wants a solid, honest foundation first.
Prerequisites: none. Basic comfort with averages and percentages helps; every statistical idea used here is explained in plain words. Keep one repeating process from your own work in mind while you read, such as resolving support tickets, approving invoices, shipping orders or deploying releases.
How to use this tutorial: read the seven lessons in order (about 45 minutes), study the five diagrams, then spend the rest of the hour on the reflection questions before you take the 25-question knowledge check.
Learning objectives:
- You will be able to explain why variation matters and describe the origins, purpose and scope of Six Sigma.
- You will be able to define and calculate the core measures, including defects per million opportunities, sigma level, rolled throughput yield and process capability.
- You will be able to describe the five DMAIC phases, the main deliverables and tools of each, and when DMADV is used instead.
- You will be able to describe how an organisation deploys Six Sigma: project selection, roles from Champion to Yellow Belt, tollgate reviews and benefit validation.
- You will be able to explain how people, projects and organisations are assessed, and what ISO 13053 and ISO 18404 do and do not provide.
- You will be able to apply DMAIC step by step to a realistic operational problem.
- You will be able to relate Six Sigma to Lean, kaizen, Total Quality Management, ISO 9001 and CMMI.
Lesson 1 – Origins, purpose and scope
Why variation is the enemy
Imagine two pizza shops that both promise delivery in 30 minutes. Both average 25 minutes. In the first shop, almost every delivery takes between 22 and 28 minutes. In the second, deliveries range from 10 to 45 minutes. The averages are identical, but the customers of the second shop regularly receive cold pizza late, and the shop pays for refunds and lost loyalty. The difference is variation: the spread of results around the average. Customers do not experience averages; they experience individual orders. A process with a good average and a wide spread will still disappoint a predictable share of them.
Six Sigma starts from this observation. It treats every repeating piece of work as a process that turns inputs into outputs, it asks what the customer actually needs from each output, and it uses data to find the few input factors that drive most of the variation and the defects. Once those causes are confirmed, the team changes the process to remove or control them, and then puts monitoring in place so that the improvement lasts. The aim is not perfection for its own sake, but fewer defects, less rework, shorter and more reliable cycle times, lower cost and happier customers.
Where it came from
The statistical roots are much older than the name. In 1924 Walter Shewhart, working at Western Electric shortly before its research staff became Bell Telephone Laboratories, introduced the control chart and the idea that some variation is a normal feature of a stable process while some signals a specific, findable cause. W. Edwards Deming and Joseph Juran carried those ideas into post-war Japanese industry, where they became part of company-wide quality management. In the 1980s, Motorola faced strong competition from Japanese manufacturers whose products failed far less often. Engineer Bill Smith and the company's leadership concluded that reliability problems came from accumulated small defects during production and set an ambitious, measurable goal for defect levels. They named the approach Six Sigma around 1986. Motorola was among the first winners of the US Malcolm Baldrige National Quality Award in 1988, which drew wide attention to its methods.
In the 1990s, AlliedSignal and then General Electric adopted Six Sigma on a large scale, tied it to financial results, trained thousands of employees in a hierarchy of "belts" and made it a core part of management. Their published savings made the method famous. In the 2000s many organisations combined it with lean thinking from the Toyota Production System to form Lean Six Sigma, which attacks waste and slow flow as well as defects and variation. In 2011 ISO published the two parts of ISO 13053, giving the first international description of the DMAIC method and its tools, and in 2015 ISO 18404 described the competencies expected of practitioners and of organisations that deploy them.
Three meanings of "Six Sigma"
The phrase is used in three related senses, and confusion between them causes much of the misunderstanding around the method.
- A metric. Sigma (σ) is the Greek letter statisticians use for standard deviation, the typical distance of individual results from the average. A "six sigma process" is one whose variation is so small that the nearest specification limit sits six standard deviations from the average. By the convention explained in Lesson 2, that corresponds to about 3.4 defects per million opportunities.
- A method. A structured problem-solving sequence, most often DMAIC (Define, Measure, Analyse, Improve, Control) for existing processes and DMADV or another Design for Six Sigma road map for new ones.
- A management system. An organisational approach that selects improvement projects from business priorities, trains people in defined roles, reviews projects at formal gates and validates the financial benefits.
Scope: what Six Sigma is good at, and what it is not
Six Sigma works best on processes that repeat often, produce measurable outputs and suffer from a problem whose cause is not yet known. Examples are an invoicing process with frequent errors, a call centre with long and unpredictable handling times, a moulding line with high scrap, or a deployment pipeline with a high rate of failed changes. It is less suitable when the solution is already obvious (just implement it), when the problem is a one-off event, when there is no way to collect data, or when the challenge is strategic choice rather than process performance. It is also a poor fit for pure invention, although Design for Six Sigma brings its discipline to new product and process design. Keep these limits in mind: much of the criticism Six Sigma has received comes from organisations that applied heavy statistical projects to problems that needed a quick fix or a cultural change.
Lesson 2 – Key concepts and vocabulary
Six Sigma has a compact vocabulary. Learning these terms early will make the rest of the method easy to follow.
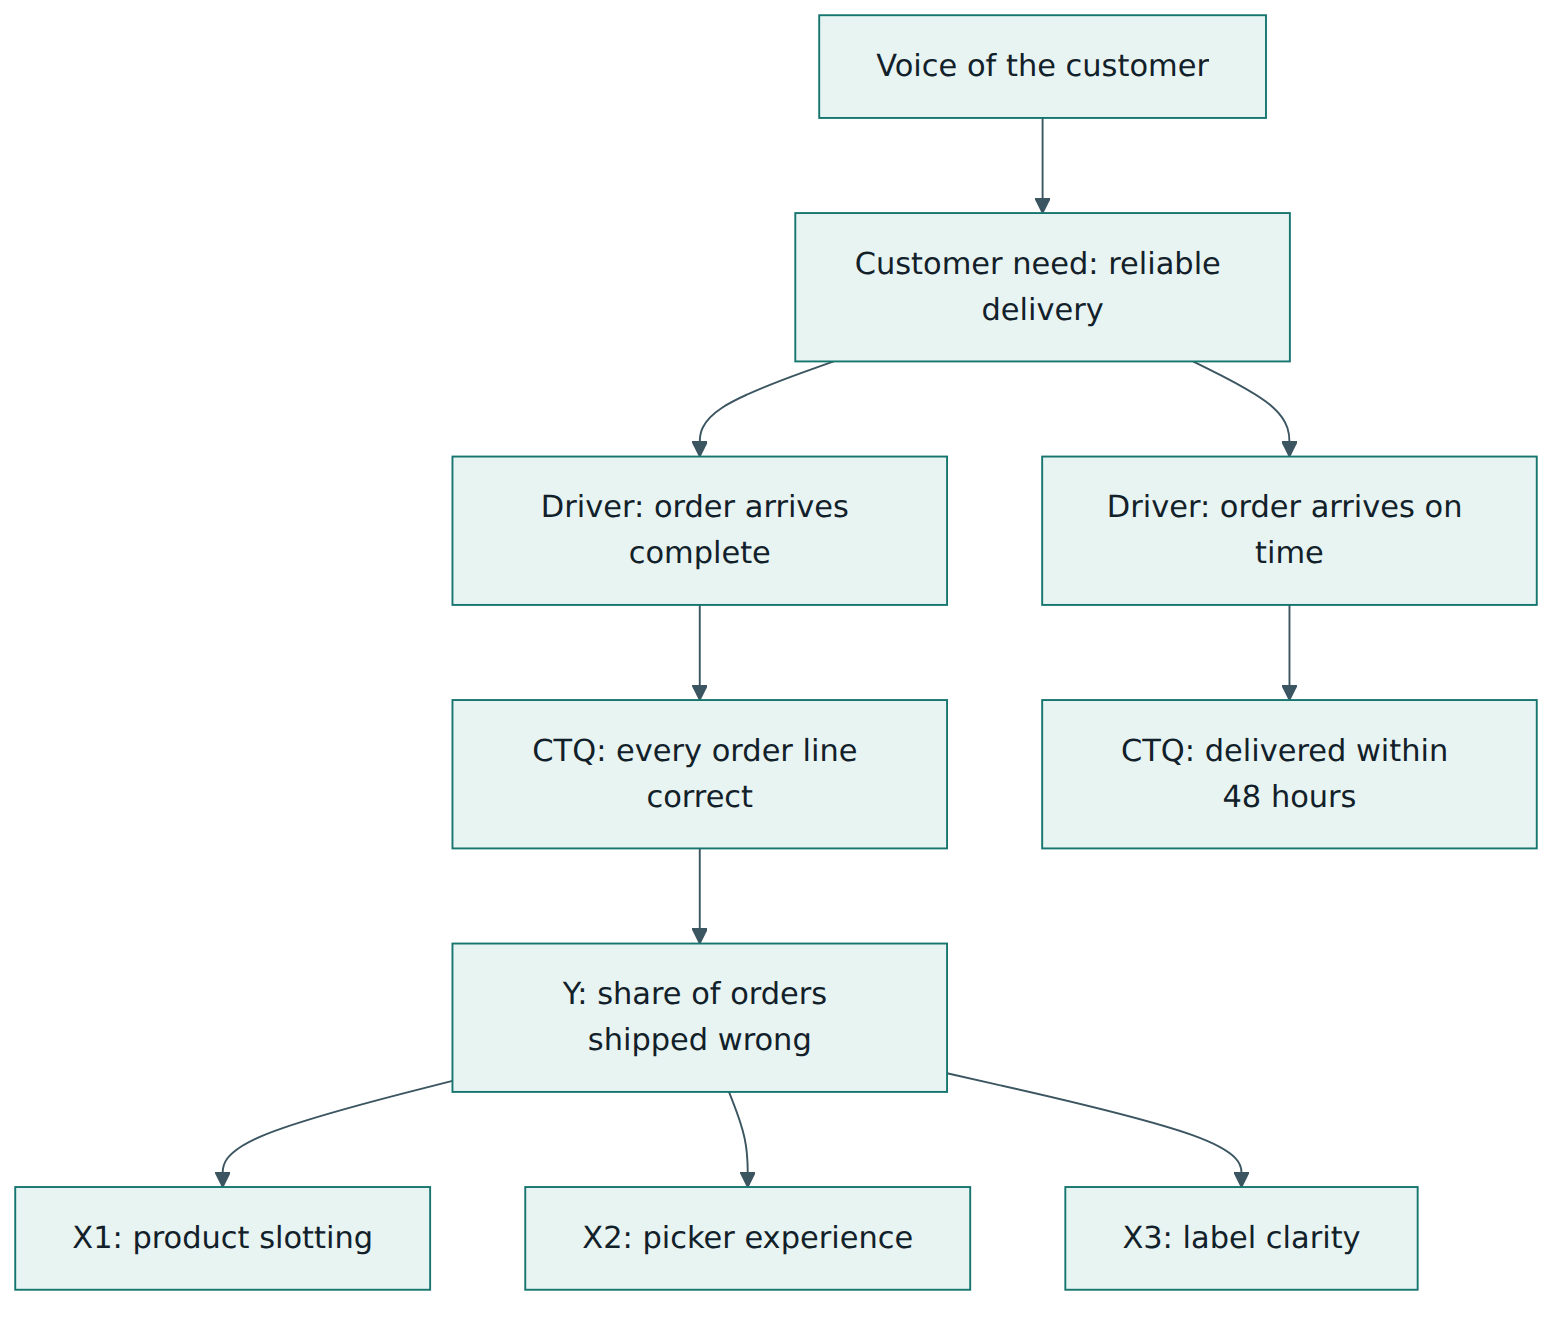
- Voice of the customer (VOC) – what customers say, do and need, gathered through interviews, complaints, surveys, usage data and observation. It is the starting point for deciding what "good" means.
- Critical to quality (CTQ) – a measurable characteristic of the output that customers care about, with a target and limits. "Fast delivery" is a need; "delivered within 48 hours of order" is a CTQ.
- Specification limits – the boundaries of acceptable performance for a CTQ: an upper specification limit (USL), a lower one (LSL), or both. They come from customers or requirements, not from the process.
- Defect – any result that falls outside a specification limit or otherwise fails a CTQ. A defective unit is a unit with one or more defects.
- Opportunity – a distinct chance for a defect to occur on one unit. A form with five independently checked fields offers five opportunities. Opportunities must be defined carefully and consistently, or the measures below become meaningless.
- DPU and DPMO – defects per unit is total defects divided by units. Defects per million opportunities divides defects by the product of units and opportunities per unit, then multiplies by one million. DPMO lets very different processes be compared on one scale.
- Sigma level – a translation of a defect rate into a number of standard deviations, read from a conversion table. Higher is better.
- Yield and rolled throughput yield (RTY) – first-pass yield is the share of units that pass a step correctly the first time, without rework. RTY multiplies the first-pass yields of all steps to give the probability that a unit passes the whole process without any rework.
- Cost of poor quality (COPQ) – the money lost because work is not done right first time: scrap, rework, returns, refunds, penalties, extra inspection, lost customers. It is how Six Sigma links defects to business results.
- Y = f(X) – the core idea that an output (Y, the result you care about) is a function of inputs and process factors (the Xs). Improve and control the critical Xs and the Y follows.
- Common-cause and special-cause variation – common-cause variation is the natural background noise of a stable process; special-cause variation comes from a specific event, such as a broken tool or a new untrained operator, and shows up as an unusual signal.
- Process capability (Cp and Cpk) – indices that compare the spread of a stable process with the width of its specification. Cp looks only at spread; Cpk also accounts for how well the process is centred.
- Measurement system analysis (MSA) – a check of whether the way you measure is accurate and consistent enough to trust. Gage repeatability and reproducibility (gage R&R) is the classic study for numeric measurements; attribute agreement analysis is used for pass/fail judgements.
- SIPOC – a one-page, high-level map listing Suppliers, Inputs, Process steps, Outputs and Customers. It sets the boundaries of a project.
- Project charter – the short document that defines the problem, goal, scope, business case, team, timeline and sponsor of a Six Sigma project.
From defects to a sigma level
Suppose a claims team processes 2,000 claims a month. Each claim has four fields that are checked independently, so each claim has four opportunities. Audits find 120 errors in a month. DPU is 120 ÷ 2,000 = 0.06. DPMO is 120 ÷ (2,000 × 4) × 1,000,000 = 15,000. Looking that up in a sigma conversion table gives a sigma level of about 3.7. The table below shows commonly quoted values.
| Sigma level | DPMO (with 1.5σ shift) | Approximate yield |
|---|---|---|
| 2 | 308,537 | 69.1 % |
| 3 | 66,807 | 93.3 % |
| 4 | 6,210 | 99.38 % |
| 5 | 233 | 99.977 % |
| 6 | 3.4 | 99.99966 % |
The 1.5 sigma shift
If a process really had its nearest specification limit six standard deviations from a fixed average, the defect rate would be about one per billion, not 3.4 per million. The difference comes from a convention adopted at Motorola: over the long term, a process average is assumed to drift by about 1.5 standard deviations as materials, people and machines change. A process that is six sigma in the short term is therefore treated as 4.5 sigma in the long term, and 4.5 standard deviations corresponds to roughly 3.4 defects per million. The shift is an engineering rule of thumb, not a law of nature, and statisticians have long debated it. In practice, what matters is to state clearly which convention you use and to use it consistently when comparing before and after.
Capability in plain words
Picture the specification as a garage door and the process output as a car. Cp asks whether the car is narrow enough to fit through the door at all: it divides the width of the specification by six standard deviations of the process. Cpk asks whether the car is actually lined up with the door: it takes the distance from the process average to the nearer limit and divides it by three standard deviations. A process can have a good Cp and a poor Cpk if it is narrow but off-centre. A short-term six sigma process has a Cp of 2.0; after the conventional 1.5σ shift, its Cpk is 1.5. Capability indices only mean something for a process that is stable, that is, showing only common-cause variation, and whose measurement system has been checked.
Rolled throughput yield and the hidden factory
Many organisations only measure final yield: of the orders that leave, how many are right? But a unit that was corrected three times before it left still consumed extra effort. Consider a four-step process in which each step gets 95 % of units right the first time. Final inspection may catch nearly everything, so final yield looks excellent, yet RTY is 0.95 × 0.95 × 0.95 × 0.95, about 81 %. Nearly one unit in five needed rework somewhere. That invisible rework is sometimes called the "hidden factory", and it is often where the largest COPQ sits.
Lesson 3 – Structure of the method: DMAIC and its variants
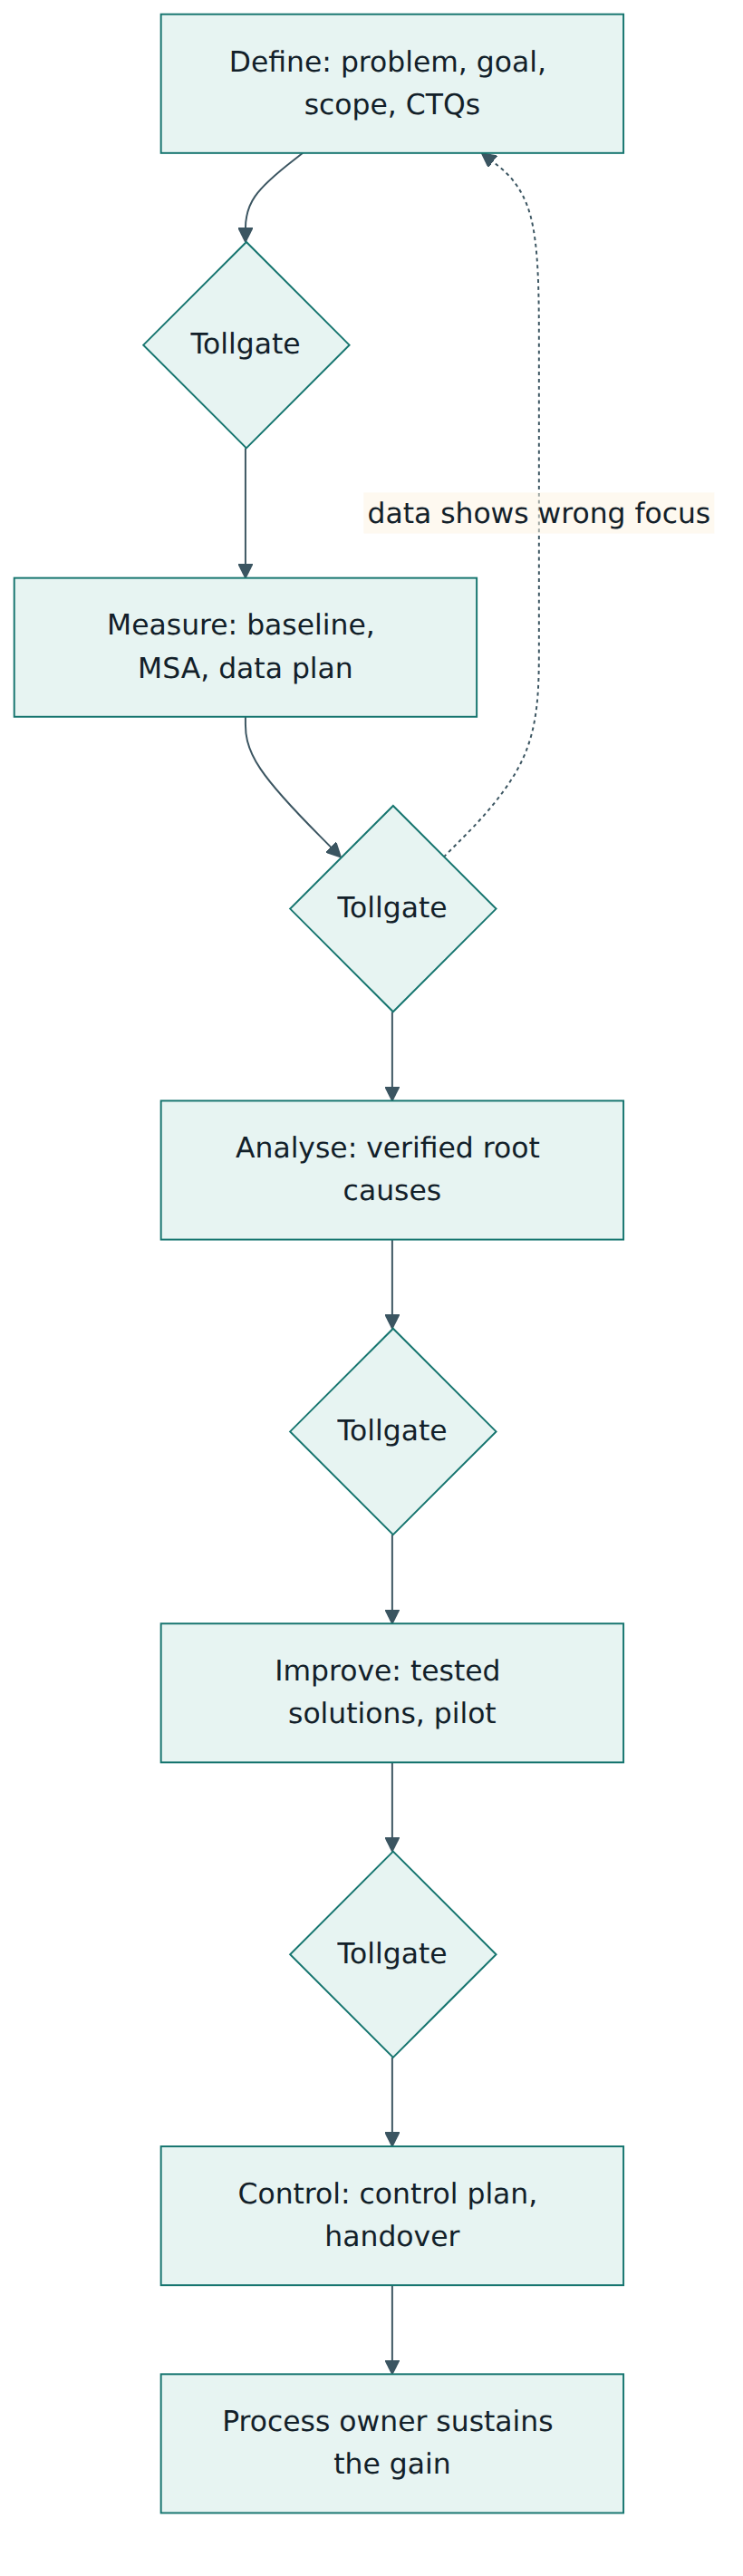
DMAIC is the backbone of Six Sigma for improving existing processes, and it is the method described in ISO 13053-1. Each phase answers one question and ends with a tollgate: a short review in which the sponsor and coach check the phase deliverables and decide whether the project continues, changes direction or stops. Stopping a project at a tollgate is not failure; it is the method protecting the organisation from spending more on a weak case.
Define – what problem, for whom, and why now?
The team writes a project charter. A good problem statement describes the gap factually (what, where, when, how much, compared with what) without assuming a cause or a solution. "Twelve per cent of new-customer invoices issued in the first half of the year contained at least one error, against a target of two per cent" is a problem statement; "we need a new billing system" is a solution in disguise. The goal is specific and time-bound. The scope says what is in and what is out, often with a SIPOC map. The business case estimates the COPQ and why it matters now. The team gathers voice-of-the-customer data and translates it into CTQs. Typical tools: charter, SIPOC, VOC interviews, CTQ tree, stakeholder analysis, a simple project plan.
Measure – how big is the problem, really?
The team turns each CTQ into an operational definition: a precise description of what is measured, how and when, so that two people would record the same result. It then checks the measurement system with an MSA study before trusting the data, builds a data collection plan, maps the process in more detail, and establishes the baseline: the current average, spread, defect rate, sigma level and, where it makes sense, capability. It is common for the Measure phase to reveal that the problem is larger, smaller or different from what everyone believed. Typical tools: detailed process maps, data collection plans, gage R&R or attribute agreement analysis, run charts, histograms, control charts, capability analysis.
Analyse – what really causes it?
The team generates candidate causes, then tests them with data. Brainstorming with a cause-and-effect (fishbone or Ishikawa) diagram organises ideas into categories such as methods, machines, materials, people, measurement and environment. A Pareto chart, which sorts problem categories from largest to smallest, usually shows that a few categories account for most of the defects. Stratifying data by shift, location, product or supplier exposes where the problem concentrates. Statistical tools then confirm or reject each suspected cause: hypothesis tests (for example t-tests, chi-square tests or ANOVA), correlation and regression, and sometimes designed experiments. The key discipline is that a cause is "root" only when data supports it; opinions and seniority do not count as evidence. Typical tools: fishbone diagram, 5 Whys, Pareto chart, stratification, scatter plots, hypothesis tests, regression, value stream analysis.
Improve – what change removes the cause?
The team generates solutions aimed at the verified root causes, selects among them with explicit criteria (impact, cost, time, risk), and assesses risks with a tool such as failure mode and effects analysis (FMEA), which rates what could go wrong with a change by severity, occurrence and detection. Where several factors interact, a design of experiments (DOE) varies them systematically to find the best settings with few trials. Before full rollout, the team pilots the change on a limited scale and measures the result against the baseline with the same operational definitions. Mistake-proofing (poka-yoke) is especially valued: a design that makes the error impossible or immediately visible is stronger than an instruction to "be careful". Typical tools: solution selection matrix, FMEA, DOE, pilot plans, mistake-proofing, future-state process maps.
Control – how do we keep the gain?
The team documents the new standard method, trains the people who do the work, and builds a control plan: a table that lists each critical X and Y, its target and limits, how and how often it is measured, who is responsible and what the reaction plan is when a signal appears. Statistical process control charts monitor the key measures. Finally, the project is formally handed over to the process owner, the benefits are validated (often by finance), and lessons learnt are shared so that similar processes elsewhere can copy the solution. Typical tools: control charts, control plan, updated standard operating procedures, training records, audit schedule, project closure report.
When DMAIC is the wrong road map
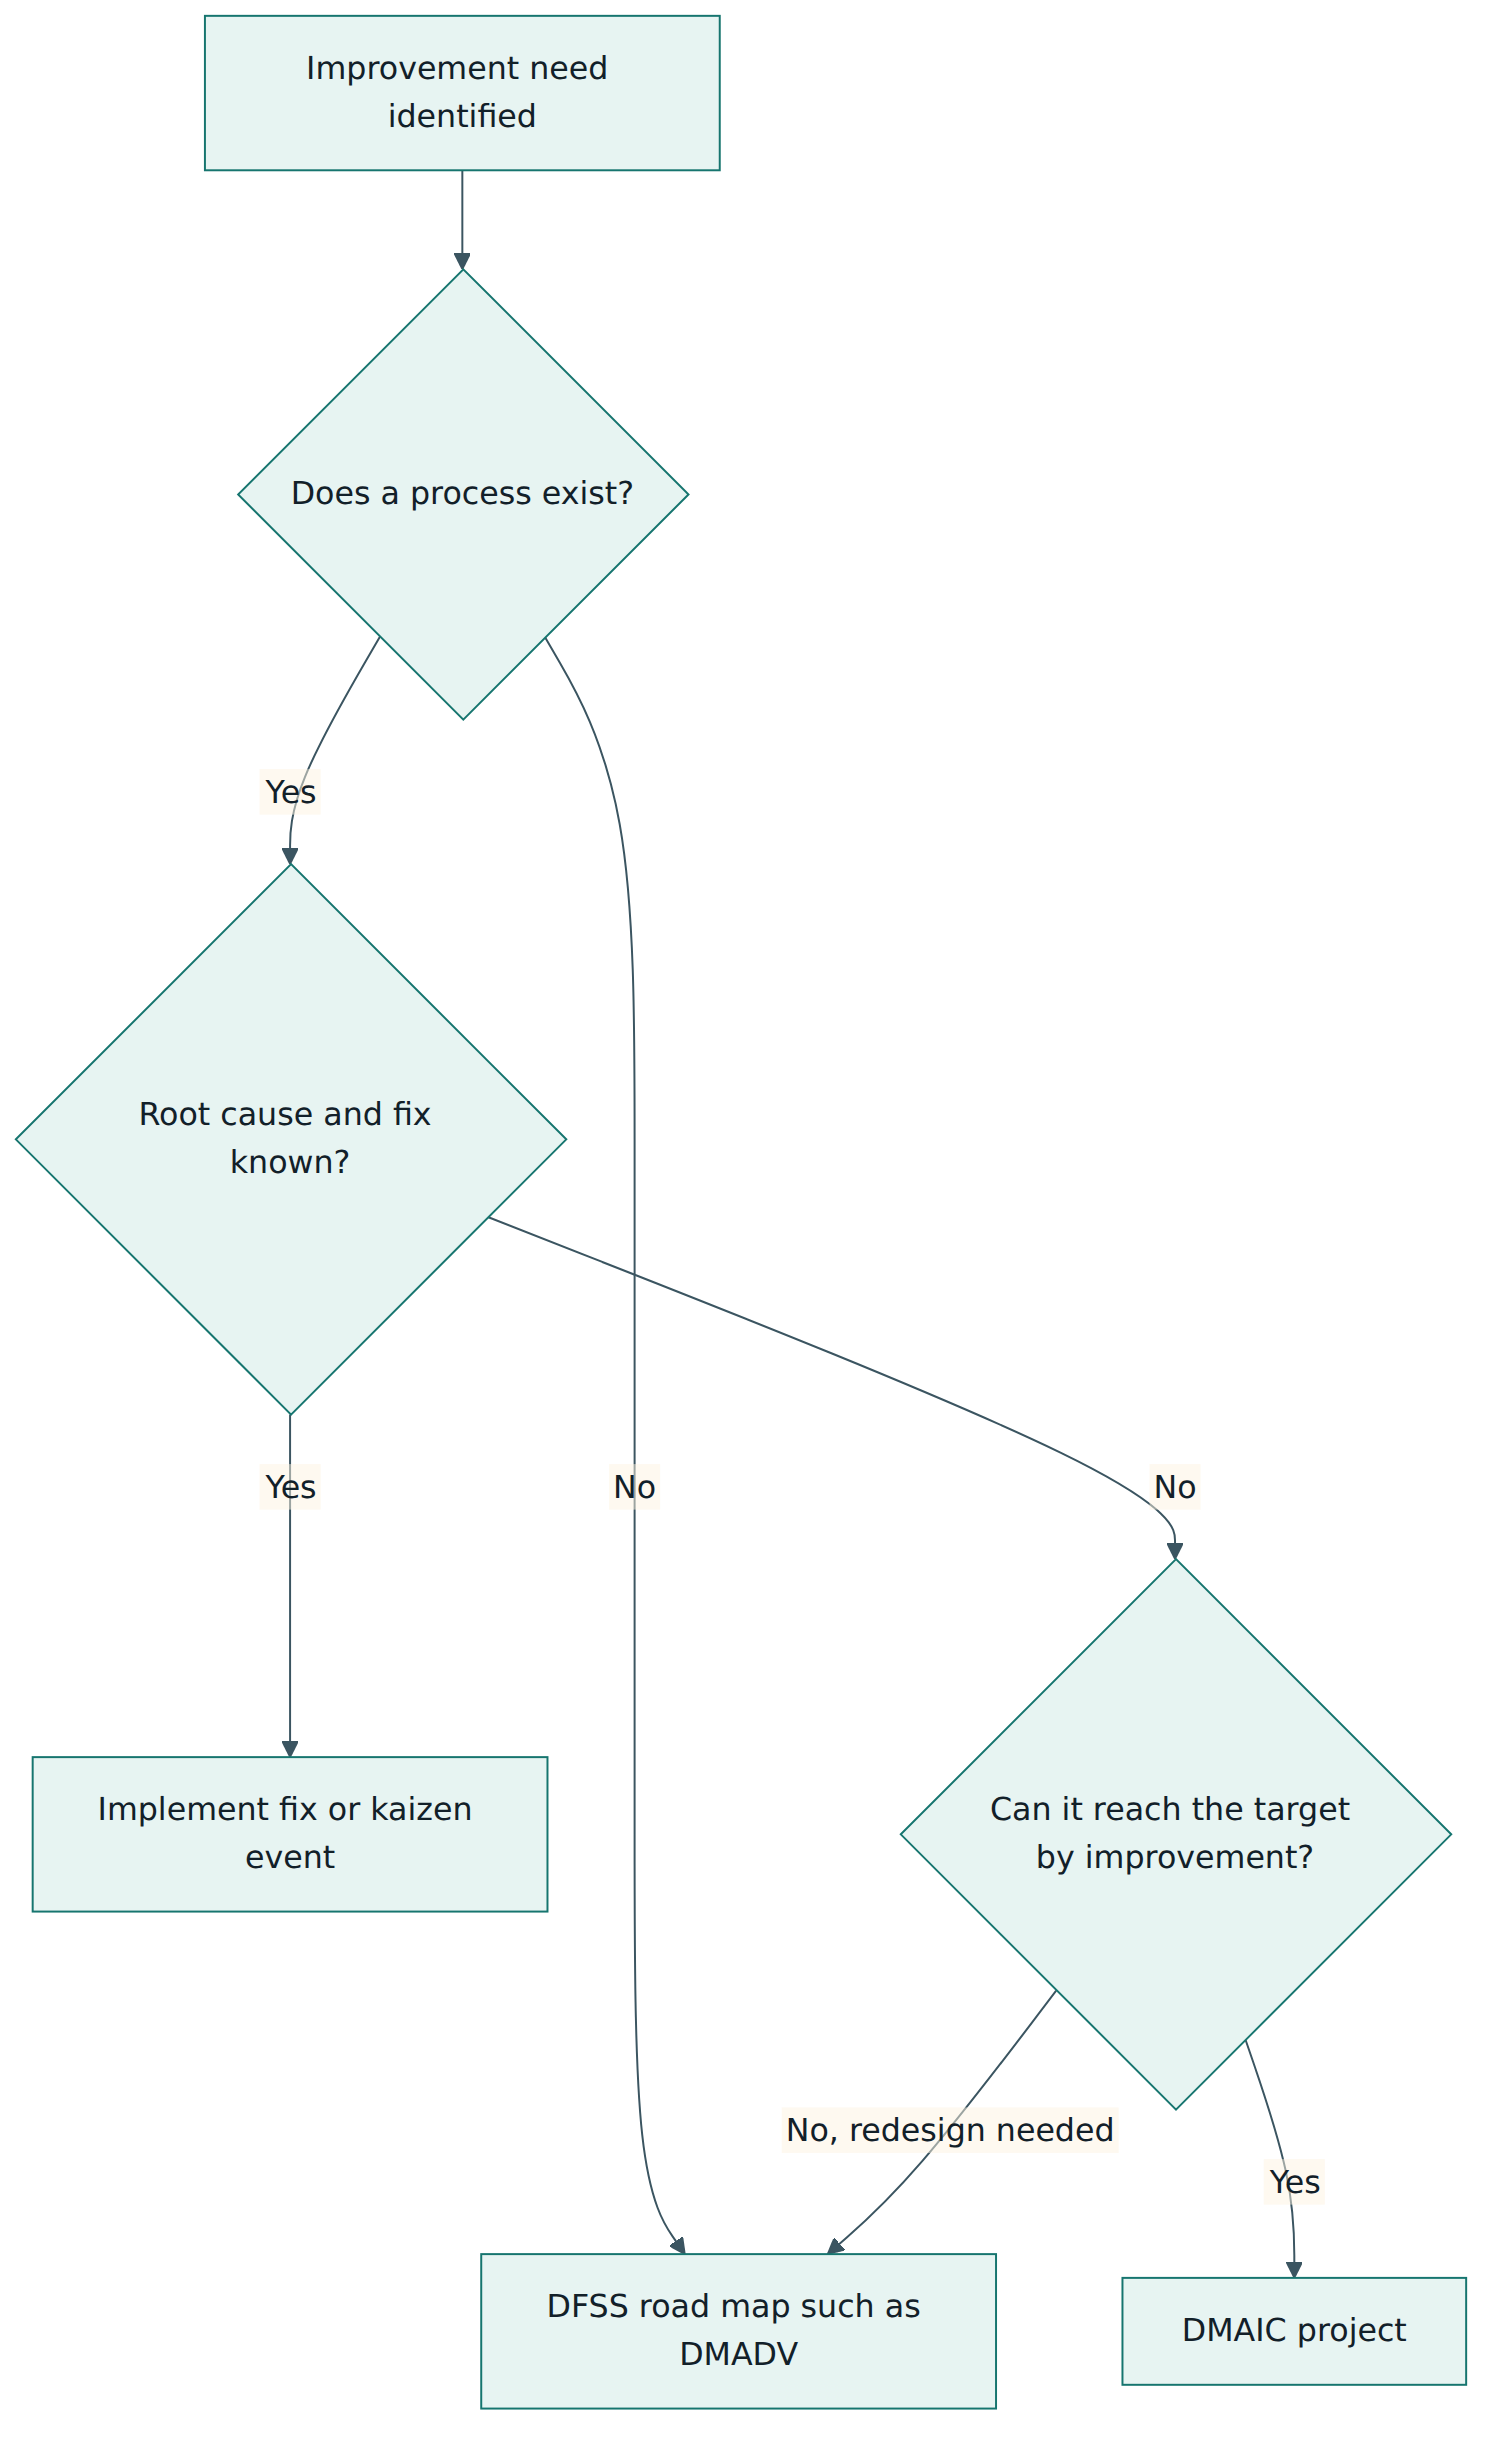
DMAIC assumes that a process exists and can be improved. When a new product, service or process is being designed, or when the current one is so far from requirements that incremental improvement cannot close the gap, Six Sigma practitioners use Design for Six Sigma (DFSS). Its best-known road map is DMADV: Define, Measure (customer needs and CTQs), Analyse (design concepts), Design (detailed design, optimised and simulated) and Verify (pilot and confirm the design meets the CTQs before full launch). Other DFSS road maps exist, such as IDOV (Identify, Design, Optimise, Validate). At the other end, when the cause and the fix are already clear and cheap, organisations simply implement the fix ("just do it") or use a fast kaizen event rather than a full project.
What ISO 13053 contains
ISO 13053-1 describes the DMAIC phases and the recommended practice in each, how Six Sigma projects should be managed, and the roles, expertise and training of the people involved, for manufacturing, service and transactional processes alike. ISO 13053-2 is a toolbox: it presents tools and techniques as factsheets and shows where each is typically used across the DMAIC phases. Both parts are guidance documents written in the language of recommendations, not a list of auditable requirements, and they deal with improving existing processes rather than with design.
Lesson 4 – How Six Sigma works in practice
Roles
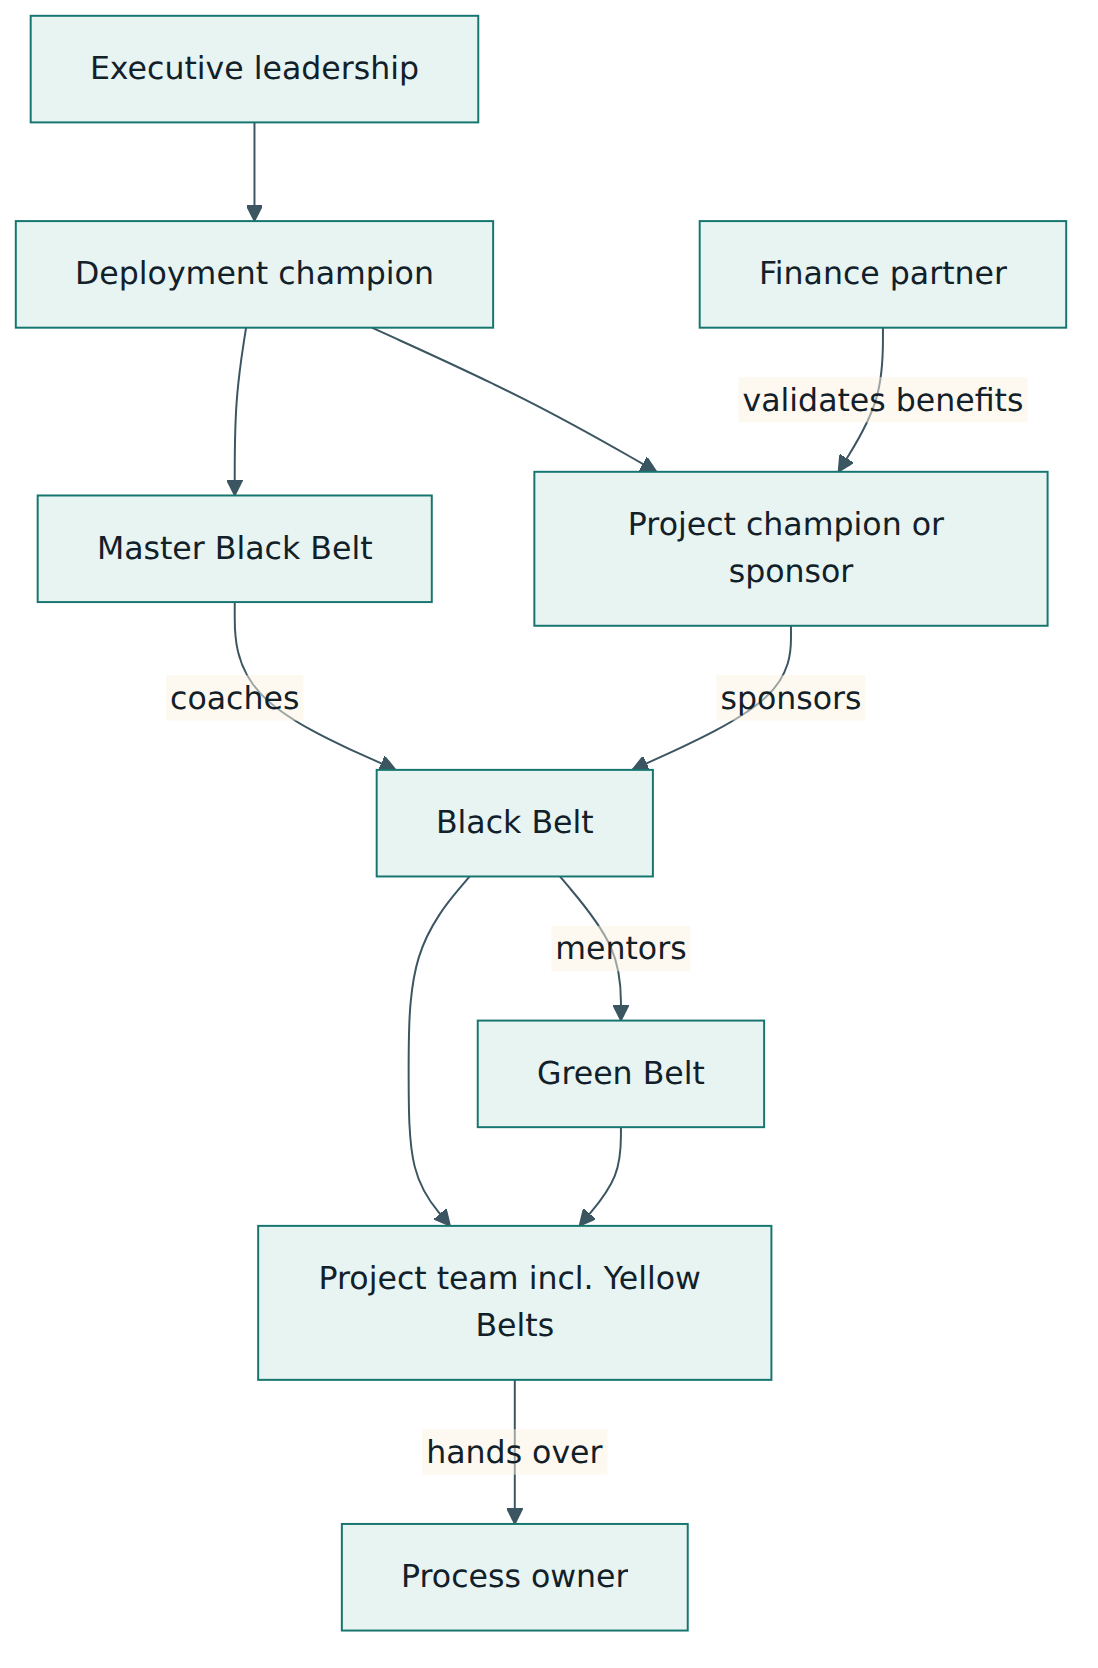
Six Sigma deployments define roles so that improvement work has sponsorship, expertise and ownership. Names vary slightly between organisations, but the pattern is consistent.
- Executive leadership and deployment champion set the direction, link the programme to business strategy, allocate people and remove organisational barriers.
- Project champion or sponsor owns the business problem, approves the charter, chairs the tollgate reviews and clears obstacles for the team.
- Master Black Belt is an expert practitioner who coaches Black and Green Belts, teaches the method, advises on statistics and helps select projects.
- Black Belt usually works on improvement full-time or nearly so, leads complex cross-functional projects and mentors Green Belts.
- Green Belt leads smaller projects or contributes to Black Belt projects while keeping a regular job.
- Yellow Belt has basic awareness training and contributes knowledge of the process as a team member.
- Process owner runs the process day to day and takes over the improved process and its control plan at the end of the project.
Selecting the right projects
Project selection is the single biggest predictor of a programme's success. Good candidates are linked to a strategic goal or a large COPQ, have a clear, measurable output, can be scoped to finish in a few months, have a committed sponsor and process owner, and have a cause that is genuinely unknown. Many organisations keep a prioritised pipeline of project ideas and score them on impact, effort, data availability and strategic fit. Projects that try to "boil the ocean", such as "improve customer satisfaction", are split into smaller, well-bounded projects. Typical durations are a few months for a Green Belt project and up to around six months for a Black Belt project, though the right duration depends on how often the process runs and how quickly data accumulates.
Running a project
A project usually follows a rhythm. The sponsor and belt agree the charter. The team, typically four to eight people who know the process, meets weekly. The belt keeps a storyboard: a short, visual record of each phase's findings that makes tollgate reviews quick and helps others reuse the work. At each tollgate the sponsor asks simple questions: is the problem still worth solving, are the data trustworthy, is the cause proven, did the pilot work, who owns the result? Statistical software is used for analysis, but most of the work is talking to people, observing the process, collecting clean data and managing change.
Validating benefits
Because Six Sigma promises business results, credible organisations check them. A finance partner agrees how savings will be calculated during Define, confirms the baseline during Measure, and validates realised benefits some months after the Control phase, distinguishing "hard" savings that change the profit and loss statement from "soft" benefits such as avoided cost or freed capacity. This discipline protects the programme from inflated claims, which quickly destroy its credibility.
Lean Six Sigma in practice
Most current deployments are Lean Six Sigma. Lean focuses on flow and on removing waste, such as waiting, unnecessary movement, overproduction and excess inventory; Six Sigma focuses on defects and variation. In practice, a team might use value stream mapping to see where time is lost, quick lean fixes such as 5S and standard work to remove obvious waste, and DMAIC statistics for the problems whose causes are hidden. The two complement each other: a fast process full of defects and a defect-free process full of waiting are both poor.
Six Sigma outside the factory
In services and IT, the "units" are transactions, tickets, requests or deployments, and the defects are errors, rework, breaches of service levels or failed changes. Measurement is often harder because data lives in several systems and definitions differ between teams, so the Measure phase deserves extra time. Cycle-time data is usually skewed rather than normally distributed, so analysts use medians, percentiles and appropriate non-normal methods rather than assuming a bell curve. The core logic, from customer need to verified cause to controlled process, is unchanged.
Lesson 5 – Assessment, certification and compliance
No single owner, no single certificate
Because no body owns Six Sigma, there is no single official certification. Assessment happens at three levels: people, projects and organisations. Understanding the differences helps you read a CV, choose a training provider or set up a programme.
Certifying people: the belts
Belt certifications are issued by professional societies, independent certification bodies, universities, training companies and large employers. They differ widely. Some, such as the American Society for Quality (ASQ), publish a body of knowledge for each level (for example Yellow, Green and Black Belt and Master Black Belt), run proctored exams and set eligibility conditions; for the Black Belt this includes evidence of completed improvement projects. Others, such as the International Association for Six Sigma Certification (IASSC), certify knowledge through an exam alone, with no project requirement. Many employers and training providers issue their own internal belts, often requiring both training and a completed project reviewed by a Master Black Belt. When you evaluate a certificate, ask: which body of knowledge does it cover, was the exam independent and proctored, was real project work required and reviewed, and does it need renewal?
Competence standard: ISO 18404
ISO 18404:2015 describes the competencies expected of key Six Sigma and Lean roles, such as Green Belt and Black Belt and comparable Lean practitioner roles, and of the organisations that deploy them. It deliberately leaves out the Yellow Belt level and Design for Six Sigma. It gives a common reference for what a belt should know and be able to do, and some training and certification bodies use it as the basis for their courses or assessments. It does not make any particular provider "official".
Assessing projects
Inside an organisation, projects are assessed at tollgates and at closure. A typical closure review checks that the problem was defined with data, the measurement system was verified, root causes were proven rather than assumed, the improvement was piloted and compared with the baseline using the same definitions, the control plan is owned by the process owner, and the benefits were validated by finance. Many organisations also audit closed projects six to twelve months later to confirm that the gains held.
Assessing organisations
ISO 13053 is guidance rather than a management-system standard with auditable requirements, so there is no accredited certification of an organisation against it in the way there is for ISO 9001. Some certification bodies nevertheless offer their own assessments or certificates referencing ISO 13053 or ISO 18404; treat these as voluntary schemes and check what they actually examined. Organisations more often judge their deployment through internal maturity assessments that look at leadership engagement, project pipeline quality, belt capacity, benefit realisation and the sustainability of results, or through broader business excellence models such as the Baldrige Excellence Framework or the EFQM Model, which reward systematic improvement without prescribing Six Sigma.
Six Sigma and compliance
No law or regulation requires Six Sigma as such. It often supports compliance with other requirements, however. ISO 9001 requires organisations to improve continually and to take corrective action on nonconformities; a DMAIC project with a verified root cause and a control plan is strong evidence of both. Automotive and medical-device quality systems expect statistical techniques such as MSA, capability studies and control charts, which are the same tools Six Sigma teaches.
Lesson 6 – Worked example: wrong orders at a distribution centre
NorthBay Supplies (a fictional company) runs a distribution centre that ships about 52,000 customer orders a month for small businesses. Customer complaints about wrong or incomplete orders have risen, and each wrong order triggers a return, a re-shipment and a support contact. The operations director sponsors a Black Belt project.
Define
The Black Belt, Amara, interviews customer service staff and reads three months of complaints. Customers say they need "the order I asked for, complete, the first time". The team defines the CTQ as "every line of the order matches the customer's request in item and quantity". The problem statement reads: "From January to June, 1.9 % of shipped orders (about 990 a month) contained a wrong item, a wrong quantity or a missing item, against a company target of 0.5 %." The estimated cost of a wrong order, including return freight, re-picking, re-shipping and support time, is about 18 currency units, giving a COPQ of roughly 18,000 a month before any lost customers are counted. The scope covers picking and packing at one site; carrier damage and supplier errors are out of scope. The goal is to reduce the wrong-order rate to 0.5 % within six months. A SIPOC map and the charter are approved at the first tollgate.
Measure
Wrong orders are counted from returns that clerks classify. Before using that data, the team runs an attribute agreement study: three returns clerks independently classify the same 50 returned orders twice. They agree with each other and with an expert classification only 78 % of the time, mainly because "wrong quantity" and "missing item" are confused. The team writes clearer operational definitions with photo examples, and a repeat study reaches 96 % agreement, which the team accepts. A data collection plan then records each wrong order with its picker, shift, zone, product family and picker tenure for eight weeks. Treating each order as one opportunity, the baseline DPMO is 19,000, which corresponds to a sigma level of about 3.6 with the 1.5σ convention. A control chart of the daily wrong-order proportion shows a stable process: the problem is built into the system, not caused by occasional incidents.
Analyse
A Pareto chart shows that wrong items make up 62 % of defects, wrong quantities 24 % and missing items 14 %. Stratification reveals that 40 product codes, in two families with very similar packaging stored in neighbouring slots, account for over half of the wrong-item defects. A fishbone session produces many other theories, including the popular belief that the night shift is careless. The team tests the theories with data. A chi-square test finds no meaningful difference between day and night shifts (p = 0.41), so that theory is dropped. Pickers with fewer than four weeks on the job have an error rate of 3.6 %, compared with 1.4 % for experienced pickers, a difference far too large to be chance (p < 0.001). Asking "why" repeatedly at the shelves shows that new pickers are trained on the job by whoever is available and that lookalike items are slotted side by side to save walking distance. Two root causes are confirmed: lookalike slotting and unstructured onboarding.
Improve
The team generates options, from adding a second inspection at packing to redesigning slotting. Extra inspection is rejected: it adds cost and does not remove the cause. The selected solutions are to separate lookalike items into non-adjacent slots, to require a barcode scan at the shelf for the 40 high-risk codes so that a wrong pick is rejected immediately (mistake-proofing), and to introduce a two-week structured onboarding with a trained buddy. An FMEA of the changes highlights a risk that scanning slows picking; the team measures it in the pilot. A three-week pilot in one zone cuts the wrong-order rate there to 0.4 %, while picks per hour fall by less than 2 %, which the sponsor accepts. The pilot data are compared with the baseline using the same definitions and the same classification process.
Control
After rollout across the site, the wrong-order proportion settles at about 0.45 %, or 4,500 DPMO, roughly 4.1 sigma. The team sets up a daily p-chart, a control chart for proportions, with a centre line of 0.45 % and control limits at about 0.04 % and 0.86 % for a typical day of 2,400 orders. The control plan names the warehouse operations manager as owner, lists the slotting rule, the scan requirement and the onboarding checklist as controlled items, and states the reaction plan: a point above the upper limit, or a run of points trending upward, triggers a same-day check of new slotting changes and recent hires. The standard operating procedures and training material are updated. Three months later, finance validates a monthly reduction in wrong-order cost of about 13,500 currency units. The project storyboard is shared with the company's two other distribution centres, which plan to copy the solution.
What the example teaches
Notice what made the project work: the problem was stated as a measured gap, the measurement system was fixed before analysis, a popular theory was tested and rejected, the solutions attacked verified causes with mistake-proofing rather than more inspection, the pilot was judged against the baseline, and the process owner took over a control plan with a clear reaction plan.
Lesson 7 – Relationship to other standards and frameworks
Six Sigma rarely stands alone. It overlaps with, borrows from and supports several other approaches. The table compares the most common ones.
| Approach | Main focus | How it relates to Six Sigma |
|---|---|---|
| Lean / Toyota Production System | Flow, waste removal, speed, respect for people | Complementary; combined as Lean Six Sigma, with lean tackling waste and delay and Six Sigma tackling defects and variation. |
| Kaizen and PDCA | Small, frequent improvements by everyone | DMAIC is a more structured, data-heavy form of the Plan-Do-Check-Act cycle; kaizen events handle problems with obvious fixes. |
| Total Quality Management (TQM) | Organisation-wide quality culture and customer focus | Six Sigma inherits TQM's statistical tools but adds project selection, defined roles and financial validation. |
| ISO 9001 | Certifiable quality management system requirements | ISO 9001 says improvement and corrective action must happen; Six Sigma is one way to do them. Neither requires the other. |
| CMMI | Process maturity for development and services | Its higher maturity levels expect quantitative and statistical management of processes, which Six Sigma tools support. |
| ISO 13053 and ISO 18404 | International description of DMAIC, tools and competencies | Reference documents for Six Sigma itself; guidance, not a governing owner. |
| Baldrige and EFQM excellence models | Holistic assessment of organisational performance | Reward systematic, data-based improvement; Six Sigma can be evidence for it but is not required. |
Lean and Six Sigma: two lenses
Lean asks "where does the work wait, move or pile up without adding value?" Six Sigma asks "why do results vary and fail to meet requirements?" A process can suffer from both. Doing a Six Sigma project on a step that should not exist at all wastes effort, so many teams map the value stream first, remove obvious waste, and then apply DMAIC where hidden causes remain.
Six Sigma and quality management systems
A quality management system such as ISO 9001 provides the framework: documented processes, objectives, internal audits, management review, corrective action and continual improvement. Six Sigma provides a powerful engine for the improvement and corrective action parts. Organisations that have both often route their most expensive or recurring nonconformities into DMAIC projects and use control plans to keep corrected processes stable, which also gives auditors clear evidence.
Six Sigma and agile or DevOps teams
Software and operations teams increasingly measure delivery performance, for example change failure rate and time to restore service. These are natural Y measures for a DMAIC project. The method's emphasis on operational definitions, baselines and verified causes fits well with blameless post-incident reviews; its weakness in fast-moving teams is speed, so lighter Green Belt-style projects or short PDCA experiments usually fit better than long Black Belt projects.
Common pitfalls and best practices
Pitfalls to avoid:
- Starting with a solution in the problem statement, which turns DMAIC into a justification exercise for a decision already made.
- Analysing data before checking the measurement system, so that conclusions rest on numbers that do not mean what everyone thinks.
- Choosing projects that are too large, poorly linked to business priorities or lacking a committed sponsor and process owner.
- Treating the belt certificate as the goal, so that training volume grows while few projects deliver lasting results.
- Using heavy statistics where a simple fix or a kaizen event would do, which makes the method look slow and bureaucratic.
- Skipping the Control phase or handing over without a clear owner and reaction plan, so the process drifts back to its old performance.
- Inflating savings claims without finance validation, which quickly destroys the programme's credibility.
- Calculating capability indices on an unstable process or assuming normal distributions for skewed data such as cycle times.
Best practices:
- Select projects from strategy and COPQ, scope them to a few months, and keep a prioritised pipeline.
- Write a factual problem statement with a baseline, a target and a scope, and get the sponsor's signature on the charter.
- Define every measure operationally and run an MSA before collecting baseline data.
- Test every suspected root cause with data and record which theories were rejected.
- Prefer mistake-proofing and process design over added inspection or warnings.
- Pilot changes and compare results with the baseline using identical definitions.
- Hand over with a control plan, updated standards and training, and audit the gains some months later.
- Combine Six Sigma with lean and quick-improvement methods, and match the weight of the tool to the size of the problem.
Summary and key takeaways
- Six Sigma is a data-driven approach to reducing defects and variation; the name refers to a metric, a method and a management system.
- Customers feel variation, not averages, so improvement must target the spread of results as well as their centre.
- Key measures include DPMO, sigma level, rolled throughput yield, Cp, Cpk and the cost of poor quality; the 3.4 DPMO figure assumes a conventional 1.5σ long-term shift.
- DMAIC (Define, Measure, Analyse, Improve, Control) improves existing processes, with tollgate reviews between phases; DMADV and other DFSS road maps are for new designs.
- Deployment relies on clear roles: leaders and champions sponsor, Master Black Belts coach, Black and Green Belts lead, and process owners sustain.
- There is no single owner or official certificate; ISO 13053 describes the method, ISO 18404 describes competencies, and belt certifications vary by provider.
- Success depends on good project selection, trustworthy measurement, verified causes, piloted solutions and a control plan owned by the process owner.
- Six Sigma complements lean, kaizen, ISO 9001 and maturity models rather than replacing them.
Reflection questions
- Choose a repeating process in your work. What is its most important CTQ, how would you define a defect and an opportunity, and what would its DPMO be with the data you have today?
- Think of a recent problem your organisation "solved". Was the root cause proven with data, or assumed? What evidence would DMAIC have demanded at the Analyse tollgate?
- Where in your organisation might a measurement system be unreliable, for example classifications made by different people, and how would you check it?
- For an improvement idea you care about, would DMAIC, DMADV or a simple fix be the right road map, and why?
- Draft a one-row control plan for a key measure in your area: what is measured, how often, by whom, and what happens when the measure signals a problem?
Further reading and official sources
- ISO 13053-1:2011 Quantitative methods in process improvement – Six Sigma – Part 1: DMAIC methodology – ISO
- ISO 13053-2:2011 Quantitative methods in process improvement – Six Sigma – Part 2: Tools and techniques – ISO
- ISO 18404:2015 Competencies for key personnel and their organizations in relation to Six Sigma and Lean implementation – ISO
- ISO/DIS 8023 Statistical methods – Six Sigma – Design for Six Sigma (draft) – ISO
- What is Six Sigma? – ASQ (American Society for Quality)
- The DMAIC process – ASQ (American Society for Quality)
- NIST/SEMATECH e-Handbook of Statistical Methods – NIST
Original tutorial by xOps School (DevOpsSchool Private Limited), written from public sources about Six Sigma. Not affiliated with or endorsed by the standard's owner; standard names are trademarks of their owners. Buy the official standard from its publisher for the authoritative text.